Commercial Products
Open Source
Terracotta Developer Console
- Introduction
- Launching the Terracotta Developer Console
- Working with Clusters
- Enterprise Ehcache Applications
- Enterprise Ehcache for Hibernate Applications
- Clustered Quartz Scheduler Applications
- Clustered HTTP Sessions Applications
- Working with Terracotta Server Arrays
- Working with Clients
- Monitoring Clusters, Servers, and Clients
- Advanced Monitoring and Diagnostics
- Recording and Viewing Statistics
- Troubleshooting the Console
- Backing Up Shared Data
- Update Checker
- Definitions of Cluster Statistics
Introduction
The Terracotta Developer Console delivers a full-featured monitoring and diagnostics tool aimed at assisting the development and testing phases of an application clustered with Terracotta. Use the Developer Console to isolate issues, discover tuning opportunities, observe application behavior under clustering, and learn how the cluster holds up under load and failure conditions.
The console functions as a JMX client with a graphical user interface. It must be able to connect to the JMX ports of server instances in the target cluster.
Enterprise versions of Terracotta also include the Terracotta Operations Center, a GUI operator's console offering features such as backups of shared data, client disconnect, and server shutdown controls. To learn more about the many benefits of an enterprise version of Terracotta, see the Terracotta products page.
Using the developer console, you can perform the following tasks:
- Monitor and manage clustered applications using Ehcache, Ehcache for Hibernate, Quartz, and Sessions.
- View all cluster events in a single window.
- View cluster-wide statistics.
- Trigger distributed garbage-collection operations.
- Monitor the health of servers and clients under changing conditions.
- Record cluster statistics for later display.
- Receive console status and server log messages in a console window.
- Discover which classes are being shared in the cluster.
These and other console features are described below.
Launching the Terracotta Developer Console
You can launch the Terracotta Developer Console from a command line.
UNIX/Linux
[PROMPT] ${TERRACOTTA_HOME}/bin/dev-console.sh&
Microsoft Windows
[PROMPT] %TERRACOTTA_HOME%\bin\dev-console.bat
| When the console first starts, it waits until every Terracotta server configured to be active has reached active status before fully connecting to the cluster. The console does not wait for standby (or passive) servers to complete startup. |
The Console Interface
When not connected to a server, the console displays a connect/disconnect panel, message-log window, status line, and an inactive cluster node in the clusters panel.
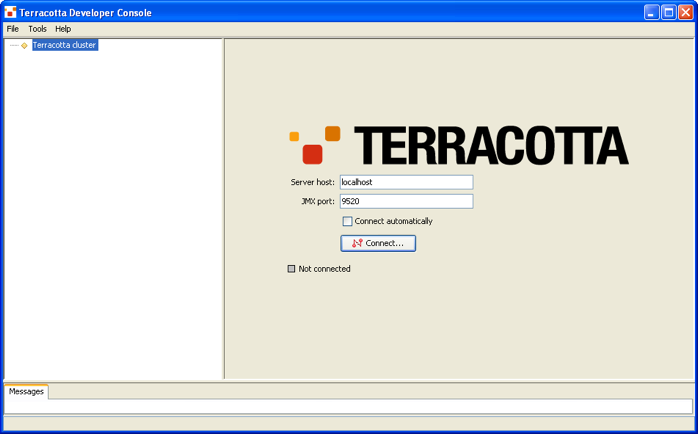
The cluster list in the clusters panel could already be populated because of pre-existing references to previously defined Terracotta clusters. These references are maintained as Java properties and persist across sessions and product upgrades. If no clusters have been defined, a default cluster (host=localhost, jmx-port=9520) is created.
The JMX port is set in each server's <server> block in the Terracotta configuration file:
<server host="host1" name="server1">
...
 <jmx-port>9521</dso-port>
...
</server>
To learn more about setting JMX ports, see the Configuration Guide and Reference.
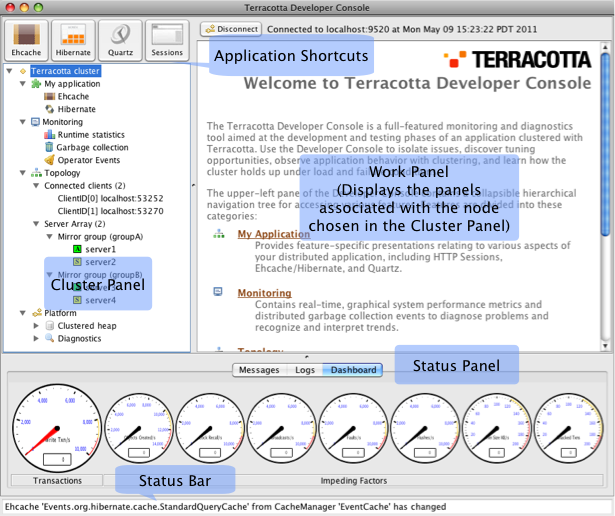
Once the console is connected to a cluster, the cluster node in the clusters panel serves as the root of an expandable/collapsible tree with nested displays and controls. One cluster node appears for each cluster you connect to.
A cluster node is created with a default name ("Terracotta cluster"). However, you can rename a cluster node by choosing Rename from its context menu.
Console Messages
Click Messages in the Status panel to view messages from the console about its operations.
Menus
The following menus are available from the console's menu bar.
File
- New Cluster – Create a new cluster node in the clusters panel.
- Quit – Shut down the console application. Has no effect on the cluster except to reduce load if the console has been recording statistics or profiling locks.
Tools
- Options – Opens the Options dialog box (see Runtime Statistics).
Help
- Developer Console Help – Go to the Developer Console documentation.
- Visit Terracotta Forums – Go to the community forums to post questions and search for topics.
- Contact Terracotta Technical Support – Go to the contact page for Terracotta technical support.
- Check for Updates – Automatically check for updates to Terracotta.
- Check Server Version – Automatically check for console-server version mismatch.
- About Terracotta Developer Console – Display information on Terracotta and the local host.
Context-Sensitive Help
Context-sensitive help is available wherever  (help button) appears in the Terracotta Developer Console. Click
in a console panel to open a web-browser page containing help on the features in that panel.
(help button) appears in the Terracotta Developer Console. Click
in a console panel to open a web-browser page containing help on the features in that panel.
Context Menus
Some console features have a context menu accessed by right-clicking the feature. For example, to open a context menu for creating a new cluster root in the clusters panel, right-click in the clusters panel.
Working with Clusters
Clusters are the highest-level nodes in the expandable cluster list displayed by the Terracotta Developer Console. A single Terracotta cluster defines a domain of Terracotta server instances and clients (application servers) being clustered by Terracotta. A single Terracotta cluster can have one or more servers and one or more clients. For example, two or more Terracotta servers configured as a server array, along with their clients, appear under the same cluster.
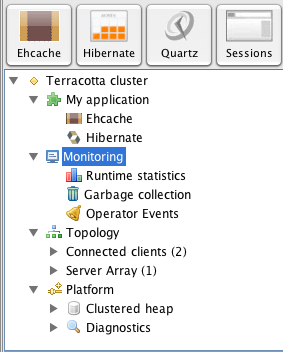
The Cluster Panel displays Terracotta application quick-view buttons as well as the cluster list. Click a quick-view button to go to a Terracotta application's panel, or click the name of the application under the My Application node. If an application is not running in the cluster, its quick-view button opens an informational window.
Adding and Removing Clusters
To add a new cluster reference, choose New cluster from the File or context menu.
The cluster topology is determined from the server specified in the connection panel's Server Host and JMX Port fields. These fields are editable when the console is not connected to the cluster.
To remove an existing cluster reference, right-click the cluster in the cluster list to open the context menu, then choose Delete.
Connecting to a cluster
To connect to an existing cluster, select the cluster node in the cluster list, then click the Connect button in the connect/disconnect panel. You can also connect to a specific cluster by choosing Connect from its context menu. After a successful connection, the cluster node becomes expandable and a connection message appears in the status bar.
To automatically connect to a cluster whenever the Terracotta Developer Console starts or when at least one of the cluster's servers is running, enable Auto-connect in the cluster context menu. Automatic connections are attempted in the background and do not interfere with normal console operation.
Connecting to a Secured Cluster
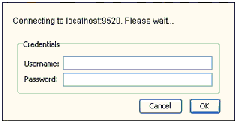
A Terracotta cluster can be secured for JMX access, requiring authentication before access is granted. Connecting to a secured cluster prompts users to enter a username and password.
- Note that the flag
-smust be passed to the launch script. - Be aware of the security issue with self-signed certificates.
For instructions on how to secure your Terracotta cluster for JMX, see Cluster Security.
Disconnecting from a Cluster
To disconnect from a cluster, select that cluster's node in the on the clusters panel and either click the Disconnect button above the help panel or select Disconnect from the cluster context menu.
Enterprise Ehcache Applications
If you are using Enterprise Ehcache with your application, the Ehcache views are available. These views offer the following features:
- Deep visibility into cached data
- Controls for enabling, disabling, and clearing all CacheManager caches
- Per-cache controls for enabling, disabling, clearing, and setting consistency
- Live statistics for the entire cluster, or per CacheManager, cache, or client
- Graphs with performance metrics for cache activity
- Historical data for trend analysis
- Parameters for control over the size and efficiency of cache regions
- A configuration generator
To access the Ehcache views, expand the My application node in the cluster navigation pane, then click the Ehcache node. If your cluster has more than one CacheManager, use the Cache Manager drop-down menu (available in all Ehcache panels) to choose the caches you want to view.
Overview Panel
The Overview panel lists all client nodes in the cluster running the CacheManager selected in the Cache Manager drop-down menu. Any operations, such as clearing cache content, performed on the caches or nodes listed in this panel affect only caches belonging to the selected CacheManager.
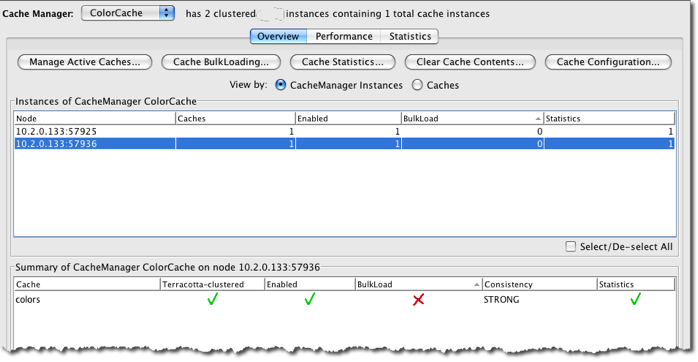
The nodes are listed in a summary table with the following columns:
- Node – The address of the client where the current CacheManager is running.
- Caches – The number of caches resident on the client.
- Enabled – The number of caches that are available to the application. Get operations will return data from an enabled cache or cause the cache to be updated with the missing data. Get operations return null from disabled caches, which are never updated.
- Bulkload – The number of caches whose data was loaded using the Bulk-Load API.
- Statistics – The number of caches from which the console is gathering statistics. Caches with disabled statistics gathering do not appear in the Performance or Statistics panels and do not contribute to aggregate statistics. If all caches have statistics disabled, the Performance or Statistics panels cannot display any statistics.
Selecting a node displays a secondary table summarizing the caches resident on that node. The caches table has the following columns:
- Cache – The name of the cache.
- Terracotta-clustered – Indicates whether the cache is clustered (green checkmark) or not (red X).
- Enabled – Indicates whether the cache is available to the application (green checkmark) or not (red X). Get operations will return data from an enabled cache or cause the cache to be updated with the missing data. Get operations return null from disabled caches, which are never updated.
- Mode – Indicates whether the cache is in bulk-load mode ("bulk loading") or not ("normal"). Caches that cannot be put into bulk-loading mode display "na". For more on bulk loading, see Bulk-Load API.
- Consistency – Indicates what mode of data consistency the cache is in (or "na" if no consistency is in effect). Available modes are STRONG and EVENTUAL. For more on cache consistency, see Terracotta Clustering Configuration Elements.
- Statistics – Indicates whether the console is collecting statistics from the cache (green checkmark) or not (red X). Caches with disabled statistics gathering do not appear in the Performance or Statistics panels and do not contribute to aggregate statistics. If all caches have statistics disabled, the Performance or Statistics panels cannot display any statistics.
- Pinned – Indicates the type of cache pinning in effect (or "na" if no pinning is in effect). For more information on pinning, see this page.
|
By default, statistics are off for caches to improve performance. Each time you start the Terracotta Developer Console and connect to a client, the client's caches will have statistics off again even if you turned statistics on previously.
To change this behavior for a cache so that statistics remain on, use Ehcache configuration:
|
You can also set the view to list the selected CacheManager's caches in the summary table instead of the nodes. In this case, in its first column the secondary table lists the nodes on which the cache is resident.
| - To work with a tree view of nodes, caches, and CacheManager instances, use the control buttons arranged at the top of the panel to open a dialog box. - To save any changes you make in a dialog box, click **OK**. To discard changes, click **Cancel**. - You can also select caches or nodes and use the context menu to perform operations. |
Enable/Disable Caches
Click Manage Active Caches to open the Manage Active Caches window. This window gives you fine-grained control over enabling caches.
To enable (or disable) caches by CacheManager instances, choose CacheManager Instances (at the top of the Manage Active Caches window), then select (enable) or unselect (disable) from the hierarchy displayed.
To enable (or disable) caches by a specific cache, choose Caches (at the top of the Manage Active Caches window), then select (enable) or unselect (disable) from the hierarchy displayed.
To save any changes you make in this window, click OK. To discard changes, click Cancel.
You can also select caches or nodes and use the context menu to enable/disable the selected caches or all caches on the selected node.
Enable/Disable Cache Bulk Loading
Click Cache Bulk Loading to open the Manage Bulk Load Mode window. This window gives you fine-grained control over enabling cache bulk-load mode.
To enable (or disable) bulk loading by CacheManager instances, choose CacheManager Instances (at the top of the Manage Bulk Load Mode window), then select (enable) or unselect (disable) from the hierarchy displayed.
To enable (or disable) bulk loading for a specific cache, choose Caches (at the top of the Manage Bulk Load Mode window), then select (enable) or unselect (disable) from the hierarchy displayed.
To save any changes you make in this window, click OK. To discard changes, click Cancel.
You can also select caches or nodes and use the context menu to enable/disable coherence for the selected caches or for all caches on the selected node.
Enable/Disable Cache Statistics
Click Cache Statistics to open the Manage Cache statistics. This window gives you fine-grained control over enabling statistics gathering. To save any changes you make in this window, click Enable Cache Statistics. To discard changes, click Cancel.
Caches with disabled statistics gathering do not appear in the Performance or Statistics panels and do not contribute to aggregate statistics. If all caches have statistics disabled, the Performance or Statistics panels cannot display any statistics.
To enable (or disable) statistics gathering by CacheManager instances, choose CacheManager Instances (at the top of the Manage Cache statistics window), then select (enable) or unselect (disable) from the hierarchy displayed.
To enable (or disable) statistics gathering for a specific cache, choose Caches (at the top of the Manage Cache statistics window), then select (enable) or unselect (disable) from the hierarchy displayed.
You can also select caches or nodes and use the context menu to enable/disable statistics for the selected caches or for all caches on the selected node.
Clear Caches
Click Clear Cache Contents to open a dialog for clearing caches.
You can also clear caches using different context menus:
- To clear the data from all caches in node, select the node, then choose Clear Caches from the node's context menu.
- To clear the data from all caches in all nodes, select all nodes, then choose Clear Caches from the nodes context menu.
- To clear the data from a specific cache (or caches) in a node, select the node, select the cache (or caches) in the cache summary table, then choose Clear Caches from the cache's context menu.
Cache Configuration
Click Cache Configuration to open a dialog with editable cache configuration. See Editing Cache Configuration for more information on editing cache configurations in the Terracotta Developer Console.
To view the Ehcache in-memory configuration file of a node, select the node, then choose Show Configuration from the context menu.
To view the Ehcache in-memory configuration of a cache, select the cache, then choose Show Configuration from the context menu.
Performance Panel
The Performance panel displays real-time performance statistics for both Global Cache Performance (aggregated from all caches) and Per-Cache Performance. The Performance panel is useful for viewing current activity in clustered caches.
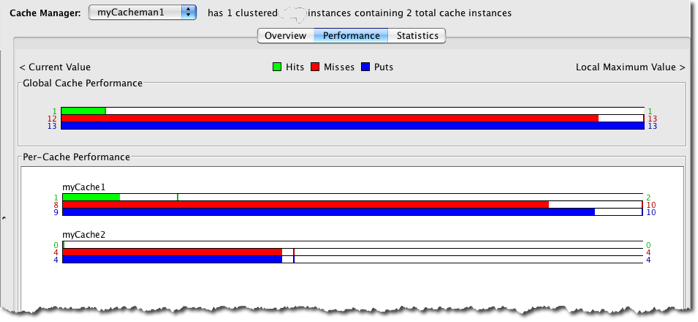
Performance statistics are displayed as color-coded bar graphs with current values shown on the left end and "high-water" (current maximum) values shown on the right end:
- Hits – (Green) Counts get operations that return data from the cache.
- Puts – (Blue) Counts each new (or updated) element added to the cache.
- Misses – (Red) Counts each cache miss; each miss causes data fault-in from outside the cache.
| The number of puts can be greater than the number of misses because updates are counted as puts. For more information on how cache events are configured and handled, see Cache Events Configuration. |
If the Performance panel is selected and statistics gathering is disabled for all caches, a warning dialog appears. This dialog offers three choices:
- Click OK to enable statistics gathering for all caches.
- Click Advanced to open the Manage Statistics window and set statistics gathering for individual caches (see the Overview Panel for more information).
- Click Cancel to leave statistics gathering off.
| Gathering statistics may have a negative impact on overall cache performance. |
Statistics Panel
The Statistics panel displays cache statistics in history graphs and a table. The graphs are useful for recognizing trends, while the table presents a snapshot of statistics and can display ordered high-low lists based on the counts shown.
If the Performance panel is selected and statistics gathering is disabled for all caches, a warning dialog appears. This dialog offers three choices:
- Click OK to enable statistics gathering for all caches.
- Click Advanced to open the Manage Statistics window and set statistics gathering for individual caches (see the Overview Panel for more information).
- Click Cancel to leave statistics gathering off.
| Gathering statistics may have a negative impact on overall cache performance. |
Some of the main tasks you can perform in this panel are:
- View cache statistics for the entire cluster.
- View cache statistics for each Terracotta client (application server).
- View statistics for specific caches cluster-wide or on selected clients.
Cache statistics are sampled at the rate determined by the rate set in the Options dialog box (see Runtime Statistics).
Use the following controls to control the statistics:
- Select View – Set the scope of the statistics display using the Select View menu. To view statistics for the entire cluster, select Cluster stats. To view statistics for an individual Terracotta client (application server), choose that client from the Per Client View submenu. Or expand either of those menus and choose a cache to view. To navigate long cache lists, highlight the list and type the first letter of the cache's name.
- Subpanel – Click the button for the subpanel you want to view (Usage, Search, JTA, or Write-Behind).
- Refresh – Click Refresh to force the console to immediately poll for statistics. A refresh is executed automatically each time a new view is chosen from the Select View menu.
- Clear – Click Clear Statistics to wipe the current display of statistics. Restarts the recording of statistics (zero out all values).
Cache Statistics Usage Graphs
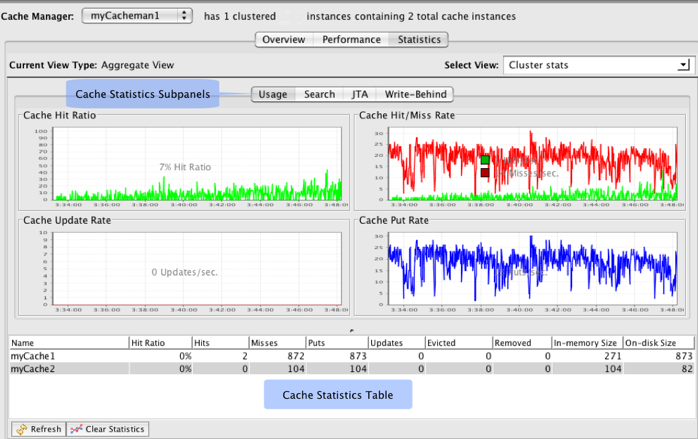
The line graphs available display the following statistics over time:
- Cache Hit Ratio – The ratio of cache hits to get attempts. A ratio of 1.00 means that all requested data was obtained from the cache (every put was a hit). A low ratio (closer to 0.00) implies a higher number of misses that result in more faulting of data from outside the cache.
- Cache Hit/Miss Rate – The number of cache hits per second (green) and the number of cache misses per second (red). Current values are overlaid on the graph. An effective cache shows a high number of hits relative to misses.
- Cache Update Rate – The number of updates to elements in the cache, per second. The current value is overlaid on the graph. A high number of updates implies a high eviction rate or rapidly changing data.
- Cache Put Rate – The number of cache puts executed per second. The current value is overlaid on the graph. The number of puts always equals or exceeds the number of misses, since every miss leads to a put. In addition, updates are also counted as puts. Efficient caches have a low overall put rate.
You can change the type of statistic a graph displays by opening its context menu, then choosing Change chart to.... Choices include CacheInMemoryHitRate and CacheAverageGetTime.
Cache Statistics Table
The cache statistics table displays a snapshot of statistics for each cache, including the following:
- Name – The name of the cache as it is configured in the CacheManager configuration resource.
- Hit Ratio – The aggregate ratio of hits to gets.
- Hits – The total number of successful data requests.
- Misses – The total number of unsuccessful data requests.
- Puts – The total number of new (or updated) elements added to the cache.
- Updates – The total number of updates made to elements in the cache.
- Expired – The total number of expired cache elements.
- Removed – The total number of evicted cache elements.
- In-Memory Size – The total number of elements in the cache on the client selected in Select View. This statistic is not available in the cluster-wide view.
- On-disk Size – The total number of elements in the cache. Even when a client is selected in Select View, this statistic always displays the cluster-wide total.
To display additional (or remove current) cache statistics:
Click Customize Columns....
Select statistics to add to the table, or clear checkboxes to remove statistics from the table.
To add or remove all statistics, select or clear Select/De-select. Float the mouse pointer over a statistic name to view its definition.
Click OK to save and apply changes, or click Cancel to leave the table as is.
Click Reset to defaults to return the original statistics to the table.
| - The snapshot is refreshed each time you display the **Statistics** panel. To manually refresh the table, click **Refresh**. - The fully qualified name of a cache shown in a table may be abbreviated. You can view the unabbreviated name in a tooltip by placing the mouse pointer over the abbreviated name. You can also view the full name of a cache by expanding the width of the **Name** column. - You can view the total sum of a column of numbers (such as **Misses** or **Puts**) in a tooltip by placing the mouse pointer anywhere in the column. - To order a table along the values of any column, double-click its heading. An arrow appears in the column heading to indicate the direction of the order. You can reverse the order by double-clicking the column head again. |
Cache Statistics Search Graphs
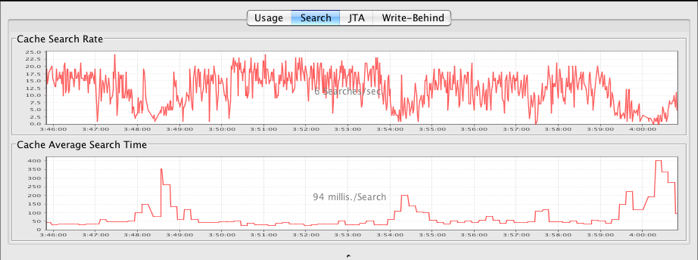
The search-related historical graphs provide a view into how quickly cache searches are being performed. The search-rate graph displays how many searches per second are being executed. The current values for these metrics are also displayed. The search-time graph displays how long each search operation takes. A correlation between how long searches are taking and how many are executed may be seen over time.
Cache Statistics JTA Graphs
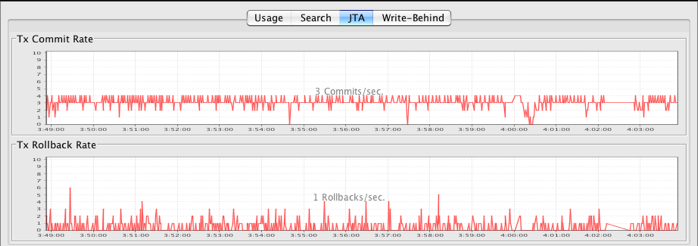
The JTA historical graphs display the transaction commit and rollback rates as well as the current values for those rates. For more information about transactional caches, see Working With Transactional Caches.
Cache Statistics Write-Behind Graphs
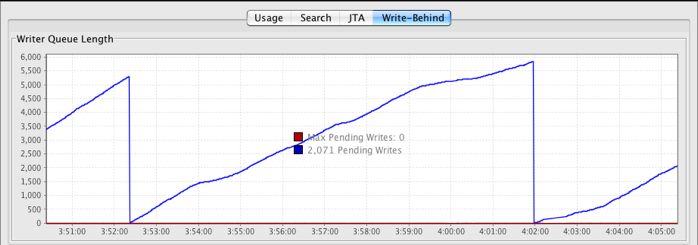
The Write-Behind historical graph displays the total number of writes in the write-behind queue or queues (blue line), as well as the current value. The graph also displays the maximum number of pending writes, or the number of elements that can be stored in the queue while waiting to be processed (red line). This value is derived from the <cacheWriter /> attribute writeBehindMaxQueueSize. Note that a value of zero ("0") sets no limit on the number of elements that can be in the queue. For more information on the write-behind queue, see Write-Behind Queue in Enterprise Ehcache.
Sizing Panel
The Sizing panel displays graphical resource-tier usage statistics for the current CacheManager and caches. Only the tiers available to the CacheManager and its caches are displayed. For example, if BigMemory is available for Ehcache, local offheap statistics are shown.
The available tiers are determined by the CacheManager and cache configuration. Possible tiers are:
- Local Heap – Local client on-heap memory.
- Local OffHeap – Local client off-heap memory, available with BigMemory for Ehcache.
- Local Disk – For versions prior to 4.x, refers either to the local client disk store of a non-clustered cache or to Terracotta storage of a clustered cache.
- Remote – Storage on the Terracotta Server Array. This is a combination of on-heap, off-heap (available with BigMemory for the Terracotta Server Array), and server disk store. Only caches are that are distributed can utilize this tier.
| The **Remote** tier reflects the amount of CacheManager and cache data stored on the Terracotta Server Array. This statistic is a client-side view and therefore is only estimate. For more accurate statistics on the Terracotta Server Array, use the Monitoring panels. |
The display is automatically refreshed every 30 seconds or manually by clicking the Refresh button.
CacheManager Utilization by Tier
A set of bar graphs showing the selected CacheManager's current usage of each tier. A red vertical line marks the limit at that amount allotted for that tier. A message above the graph indicates whether the CacheManager is configured with all size-based caches ("size-base pooling") or mixed caches (only size-based caches are displayed).
CacheManager Relative Cache Sizes
Gives a pie-chart of tier usage by cache. Select the tier to display from the Tier menu.
A table provides the following information for each cache:
- Cache – The name of the cache.
- Size in Bytes – The size of the cache on the selected tier.
- % of Used – Percentage taken up by the cache of the portion of the tier that is being used by all of the caches.
- Entries - The number of cache entries on the selected tier.
- Mean Value Size – The estimated size of each cache entry on the selected tier.
Cache Utilization by Tier
A set of bar graphs showing the selected cache's current usage of each tier. A red vertical line marks the limit at that amount allotted for that tier. A message above the graph indicates whether the cache takes its size configuration from the CacheManager (pool-base) or is configured with its own sizing (size-based).
Cache Misses by Tier
A set of bar graphs showing the total cache misses in each tier for the selected cache.
Editing Cache Configuration
In the Overview panel, click Cache Configuration to open the Manage Cache Configuration dialog. The dialog displays a table of existing clustered and unclustered caches with storage and eviction properties. The configuration shown is loaded from the initial configuration resource. For example, if the CacheManager is initialized with a configuration file, the values from that file appear in Configuration panel.
The cache-configuration tables display the following editable configuration properties for each cache:
- Cache – The name of the cache as it is configured in the CacheManager configuration resource. Since unclustered caches, also called standalone caches, are local only, a drop-down menu allowing you to select the standalone caches CacheManager is provided for their table.
- Max Memory Elements – The maximum number of elements allowed in the cache in any one client (any one application server). If this target is exceeded, eviction occurs to bring the count within the allowed target. 0 means no eviction takes place (infinite size is allowed).
- Max Disk Elements – The maximum total number of elements allowed in the cache in all clients (all application servers). If this target is exceeded, eviction occurs to bring the count within the allowed target. 0 means no eviction takes place (infinite size is allowed).
- Time-To-Idle (TTI) – The maximum number of seconds an element can exist in the cache without being accessed. The element expires at this limit and will no longer be returned from the cache. 0 means no TTI eviction takes place (infinite lifetime).
- Time-To-Live (TTL) – The maximum number of seconds an element can exist in the cache regardless of use. The element expires at this limit and will no longer be returned from the cache. 0 means no TTL eviction takes place (infinite lifetime).
| Having the values of TTI, TTL, Max Memory Elements, and Max Disk Elements all set to 0 for a cache in effect *turns off *all eviction for that cache. Unless you want cache elements to *never *be evicted from a cache, you should set these properties to non-zero values that are optimal for your use case. |
To edit a configuration property, click the field holding the value for that property, then type a new value. Changes are not saved to the cache configuration file and are not persisted beyond the lifetime of the CacheManager.
To create a configuration file based on the configuration shown in the panel, select a node in the Overview panel and choose Show Configuration to open a window containing a complete Ehcache configuration file. Copy this configuration and save it to a configuration file loaded by the CacheManager (for example, ehcache.xml).
To get the configuration for a single cache, select the cache in the Overview panel and choose Show Configuration to open a window containing the cache's configuration.
For more information on the Enterprise Ehcache configuration file, see Ehcache Configuration File.
Enterprise Ehcache for Hibernate Applications
If you are using Enterprise Ehcache with your Hibernate-based application, the Hibernate and second-level cache views are available. These views offer you the following:
- Deep visibility into Hibernate and cached data
- Live statistics
- Graphs, including puts and misses
- Historical data for trend analysis
- Parameters for control over the size and efficiency of cache regions
- A configuration generator
To access the Hibernate and second-level cache views, expand the My application node in the cluster navigation pane, then click the Hibernate node.
| Each time you connect to the Terracotta cluster with the Developer Console, Hibernate and cache statistics gathering is automatically started. Since this may have a negative impact on performance, consider disabling statistics gathering during performance tests and in production. To disable statistics gathering, navigate to the **Overview** panel in the second-level cache view, then click **Disable Statistics**. |
Use the view buttons to choose Hibernate (Hibernate statistics) or Second-Level Cache (second-level cache statistics and controls).
| The following are productivity tips for using the Developer Console: - The fully qualified name of a region, entity, or collection shown in a table may be abbreviated. You can view the unabbreviated name in a tooltip by placing the mouse pointer over the abbreviated name. Note that expanding the width of a column does not undo abbreviations. - Queries are not abbreviated, but can still appear to be cut off by columns that are too narrow. To view the full query string, you can expand the column or view the full query string in a tooltip by placing the mouse pointer over the cut-off query string. - You can view the total sum of a column of numbers (such as Hibernate Inserts) in a tooltip by placing the mouse pointer anywhere in the column. - To order a table along the values of any column, double-click its heading. An arrow appears in the column heading to indicate the direction of the order. You can reverse the order by double-clicking the column head again. - Some panels have a **Clear All Statistics** button. Clicking this button clears statistics from the current panel and all other Hibernate and cache panels that display statistics. - If your cluster has more than one second-level cache, use the **Persistence Unit** drop-down menu (available in all panels) to choose the cache you want to view. |
Hibernate View
Click Hibernate view to display a table of Hibernate statistics. Some of the main tasks you can perform in this view are:
- View statistics for the entire cluster on Hibernate entities, collections, and queries.
- View statistics for each Terracotta client (application server) on Hibernate entities, collections, and queries.
Hibernate statistics are sampled at the rate determined by the rate set in the Options dialog box (see Runtime Statistics). Use the controls that appear below the statistics table to update the statistics:
- Refresh – Click Refresh to force the console to immediately poll for statistics.
- Clear – Click Clear All Statistics to wipe the current display of statistics.
You can set the scope of the statistics display using the Select View menu. To view statistics for the entire cluster, select Cluster stats. To view statistics for an individual Terracotta client (application server), choose that client from the Per Client View submenu.
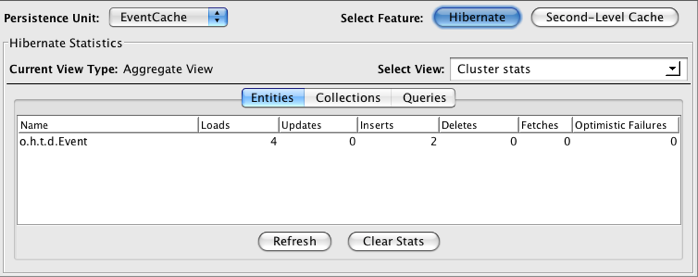
Entities
Click Entities to view the following standard Hibernate statistics on Hibernate entities in your application:
- Name
- Loads
- Updates
- Inserts
- Deletes
- Fetches
- Optimistic Failures
Collections
Click Collections to view the following standard Hibernate statistics on Hibernate collections in your application:
- Role
- Loads
- Fetches
- Updates
- Removes
- Recreates
Queries
Click Queries to view the following standard Hibernate statistics on Hibernate queries in your application:
- Query
- Executions
- Rows
- Avg Time (Average Time)
- Max Time (Maximum Time)
- Min Time (Minimum Time)
Second-Level Cache View
The second-level cache view provides performance statistics and includes per-region cache configuration. Some of the main tasks you can perform in this view are:
- View both live and historical performance metrics in graphs.
- Enable and disable cache regions.
- Flush cache regions.
- Set eviction parameters per region.
- Generate a configuration file based on settings in the Second-Level Cache view.
Overview
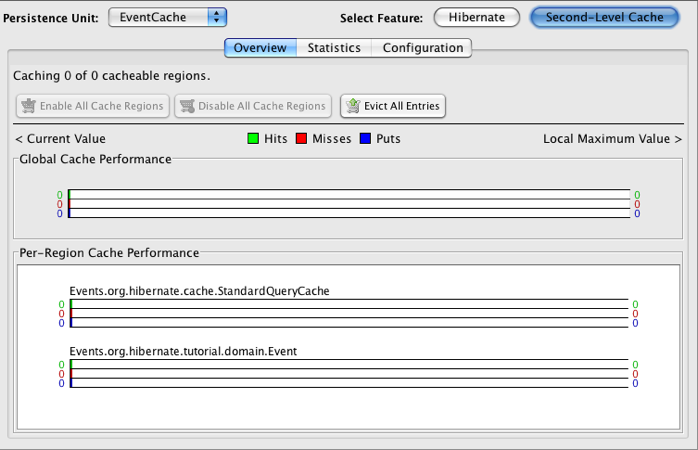
The Overview panel displays the following real-time performance statistics for both Global Cache Performance (covering the entire cache) and Per-Region Cache Performance:
- Hits – (Green) Counts queries that return data from the second-level cache.
- Puts – (Blue) Counts each new (or updated) element added to the cache.
- Misses – (Red) Counts each cache miss; each miss causes data fault-in from the database.
| The number of puts can be greater than the number of misses because updates are counted as puts. |
These statistics are displayed as color-coded bar graphs with current values shown on the left end and "high-water" (current maximum) values shown on the right end.
The Overview panel provides the following controls:
- Enable All Cache Regions – Turns on all configured cache regions.
- Disable All Cache Regions – Turns off all configured cache regions shown.
- Evict All Entries – Removes all entries from the cache (clears the cache).
- Disable Statistics – Turns off the gathering of statistics. Only DB SQL Execution Rate (queries per second), In-Memory Count, and Total Count of cache elements continue to function. When statistics gathering is off, this button is called Enable Statistics. Gathering statistics may have a negative impact on performance.
- Clear All Statistics – Restart the recording of statistics (zero out all values).
Statistics
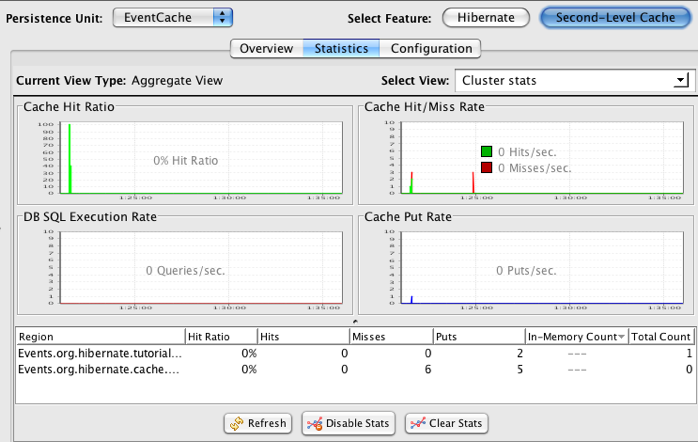
The Statistics panel displays second-level cache statistics in history graphs and a table. The graphs are useful for recognizing trends, while the table presents a snapshot of statistics.
Some of the main tasks you can perform in this panel are:
- View cache statistics for the entire cluster.
- View cache statistics for each Terracotta client (application server).
Cache statistics are sampled at the rate determined by the rate set in the Options dialog box (see Runtime Statistics). Use the controls that appear below the statistics table to update the statistics:
- Refresh – Click Refresh to force the console to immediately poll for statistics.
- Clear – Click Clear All Statistics to wipe the current display of statistics.
You can set the scope of the statistics display using the Select View menu. To view statistics for the entire cluster, select Cluster stats. To view statistics for an individual Terracotta client (application server), choose that client from the Per Client View submenu.
Cache Statistics Graphs
The line graphs available display the following statistics over time:
- Cache Hit Ratio – The ratio of cache hits to queries. A ratio of 1.00 means that all queried data was obtained from the cache. A low ratio (closer to 0.00) implies a higher number of misses that result in more faulting of data from the database.
- Cache Hit/Miss Rate – The number of cache hits per second (green) and the number of cache misses per second (red). Current values are overlaid on the graph.
- DB SQL Execution Rate – The number of queries executed per second. The current value is overlaid on the graph.
- Cache Put Rate – The number of cache puts executed per second. The number of puts always equals or exceeds the number of misses, since every miss leads to a put. The current value is overlaid on the graph.
Cache Statistics Table
The cache statistics table displays a snapshot of the following statistics for each region:
- Region – The fully qualified name of the region (abbreviated).
- Hit Ratio – The aggregate ration of hits to queries.
- Hits – The total number of successful queries on the cache.
- Misses – The total number of unsuccessful queries on the cache.
- Puts – The total number of new (or updated) elements added to the cache.
- In-Memory Count – The total number of cache elements in the region on the client selected in Select View. This statistic is not available in the cluster-wide view.
- Total Count – The total number of cache elements in the region. Even when a client is selected in Select View, this statistic always displays the cluster-wide total.
- Hit Latency – The time (in milliseconds) it takes to find an element in the cache. Long latency times may indicate that the cache element is not available locally and is being faulted from the Terracotta server.
- Load Latency – The time (in milliseconds) it takes to load an entity from the database after a cache miss.
The snapshot is refreshed each time you display the Statistics panel. To manually refresh the table, click Refresh.
Configuration
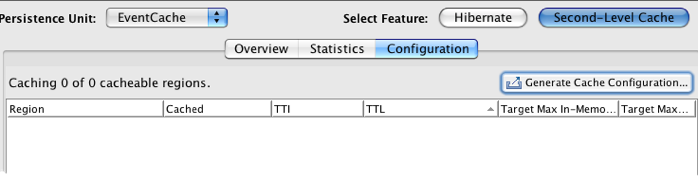
The Configuration panel displays a table with the following configuration properties for each cache region:
- Region – The fully qualified name of the region (abbreviated).
- Cached – Whether the region is currently being cached ("On") or not ("Off").
- TTI (Time to idle) – The maximum number of seconds an element can exist in the cache without being accessed. The element expires at this limit and will no longer be returned from the cache. 0 means no TTI eviction takes place (infinite lifetime).
- TTL (Time to live) – The maximum number of seconds an element can exist in the cache regardless of use. The element expires at this limit and will no longer be returned from the cache. 0 means no TTL eviction takes place (infinite lifetime).
- Target Max In-Memory Count – The maximum number of elements allowed in a region in any one client (any one application server). If this target is exceeded, eviction occurs to bring the count within the allowed target. 0 means no eviction takes place (infinite size is allowed).
- Target Max Total Count – The maximum total number of elements allowed for a region in all clients (all application servers). If this target is exceeded, eviction occurs to bring the count within the allowed target. 0 means no eviction takes place (infinite size is allowed).
| Having the values of TTI, TTL, Max Memory Elements, and Max Disk Elements all set to 0 for a cache in effect *turns off *all eviction for that cache. Unless you want cache elements to *never *be evicted from a cache, you should set these properties to non-zero values that are optimal for your use case. |
Configuration is loaded from the initial configuration resource. For example, if the second-level cache is initialized with a configuration file, the values from that file appear in Configuration panel.
Region Operations
To stop a region from being cached, select that region in the configuration table, then click Disable Region. Disabled regions display "Off" in the configuration table's Cached column. Queries for elements that would be cached in the region must go to the database to return the desired data.
To return a region to being cached, select that region in the configuration table, then click Enable Region. Disabled regions display "On" in the configuration table's Cached column.
To clear a region, select that region in the configuration table, then click Evict All Entries in Cache. This operation removes from all clients all of the entries that were cached in that region.
If you are troubleshooting or otherwise require more detailed visibility into the workings of the second-level cache, enable Logging enabled.
Region Settings
To change the configuration for a region, select that region in the configuration table, then change the values in the fields provided:
- Time to idle
- Time to live
- Target max total count
- Target max in-memory count
You can also turn logging on for the region by selecting Logging enabled.
The settings you change in the second-level cache view are not saved to the cache configuration file and are not persisted beyond the lifetime of the cache. To create a configuration file based on the configuration shown in the second-level cache view, click Generate Cache Configuration... to open a window containing a complete configuration file. Copy this configuration and save it to a configuration file loaded by the used for configuring the second-level cache (such as the default ehcache.xml). For more information on Enterprise Ehcache configuration file, see Ehcache Configuration File.
Clustered Quartz Scheduler Applications
The Terracotta JobStore for Quartz Scheduler clusters the Quartz job-scheduling service. If you are clustering Quartz Scheduler, the Quartz view is available. The Quartz view offers the following features:
- Activity meters
- Start/stop and pause controls for schedulers, job groups, and jobs
- Job execution history
- Ability to delete individual job details
To access the Quartz view, expand the My application node in the cluster navigation pane, then click the Quartz node.
Choose the scheduler to display from the Quartz Schedulers menu, available at the top of any of the Quartz view's panels. For the currently chosen scheduler, the Quartz view provides the following panels:
Overview
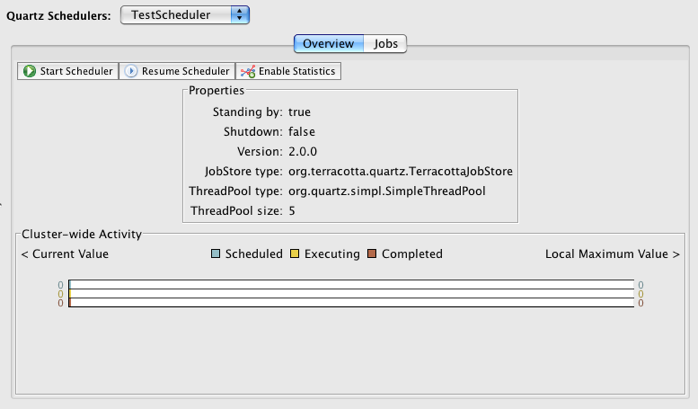
The Overview panel displays the following real-time cluster-wide activity meters:
- Scheduled – (Green) Shows count of new jobs scheduled at the time of polling.
- Executing – (Yellow) Shows count of currently executing jobs.
- Completed – (Red) Shows count of jobs that have completed at the time of polling.
These counts are displayed as color-coded bar graphs with current values shown on the left end and "high-water" (current maximum) values shown on the right end. If statistics are disabled, no counts are displayed on the activity meters (see below for how to enable statistics).
The Overview panel provides the following controls:
- Stop Scheduler – Stop (destroy) the currently selected scheduler. The scheduler cannot be restarted.
- Pause Scheduler – Suspend the scheduler from any activity. When a scheduler is paused, click Resume Scheduler to restart it.
- Disable Statistics – Turns off the gathering of statistics. When statistics gathering is off, this button is called Enable Statistics. Gathering statistics may have a negative impact on performance.
The panel also displays a summary of properties for the selected scheduler.
Jobs
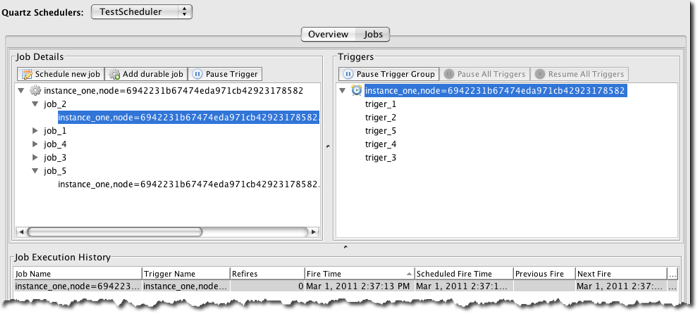
The Jobs panel displays information about the jobs and triggers managed by the selected scheduler. The Jobs panel is composed of the following:
Job Details Subpanel
Contains an expandable/collapsible list of job groups. When expanded, each job-group node lists its jobs, and each job lists its triggers when it's expanded. Selecting a node displays context-sensitive controls (buttons) along the top of the subpanel:
- Group selected – Pause Job Group (Resume Job Group). These controls also appear in the node's context menu.
- Job selected – Delete Job, Schedule Job. These controls also appear in the node's context menu along with Pause Job (Resume Job), Trigger Job.
- Trigger selected – Pause Trigger (Resume Trigger). These controls, along with Pause All Triggers (pauses all triggers for the job) and Unschedule Job (removes the trigger from the job), also appear in the node's context menu.
Triggers subpanel
Contains an expandable/collapsible list of trigger groups. When expanded, each trigger-group node lists its triggers. The control Pause All Triggers appears along the top of the panel and will pause all triggers in the selected trigger group.
Selecting a node displays additional context-sensitive controls (buttons) along the top of the subpanel:
- Trigger group selected – Pause Trigger Group (Resume Trigger Group). These controls also appear in the node's context menu.
- Trigger selected – Pause Trigger (Resume Trigger). These controls also appear in the node's context menu.
Job Execution History table
The Job Execution History table lists the jobs that have been run by the selected scheduler. The table shows the following data:
- Job Name
- Trigger Name
- Refires (number of times job has been refired)
- Fire Time
- Scheduled Fire Time
- Previous Fire (time)
- Next Fire (time)
- Job Completion Time (milliseconds)
The table can be cleared by selecting Clear from its context (right-click) menu.
Clustered HTTP Sessions Applications
If you are clustering Web sessions, the HTTP sessions view is available. The sessions view offers the following features:
- Live statistics
- Graphs, including session creation, hop, and destruction rates
- Historical data for trend analysis
- Ability to expire any individual session or all sessions
To access the HTTP Sessions view, expand the My application node in the cluster navigation pane, then click the HTTP Sessions node.
| Each time you connect to the Terracotta cluster with the Developer Console, statistics gathering is automatically started. Since this may have a negative impact on performance, consider disabling statistics gathering during performance tests and in production. To disable statistics gathering, navigate to the **Overview** or **Runtime Statistics** panel, then click **Disable Statistics**. The button's name changes to **Enable Statistics**. |
The HTTP Sessions view has the following panels:
Overview
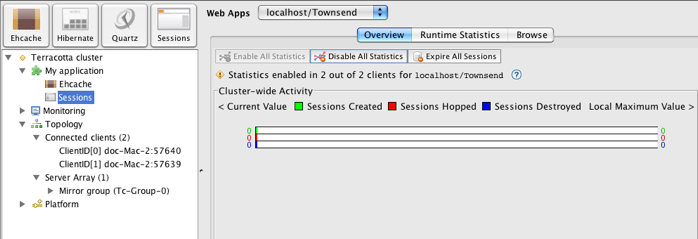
The Overview panel displays the following real-time performance statistics:
- Sessions Created – (Green) Counts new sessions.
- Sessions Hopped – (Yellow) Counts each time a session changes to another application server.
- Sessions Destroyed – (Red) Counts each time a session is torn down.
These statistics are displayed as color-coded bar graphs with current values shown on the left end and "high-water" (current maximum) values shown on the right end.
The Overview panel provides the following controls:
- Expire All Sessions – Close all sessions.
- Enable Statistics – Turns on the gathering of statistics. Gathering statistics may have a negative impact on performance.
- Disable Statistics – Turns off the gathering of statistics.
Runtime (Sessions) Statistics
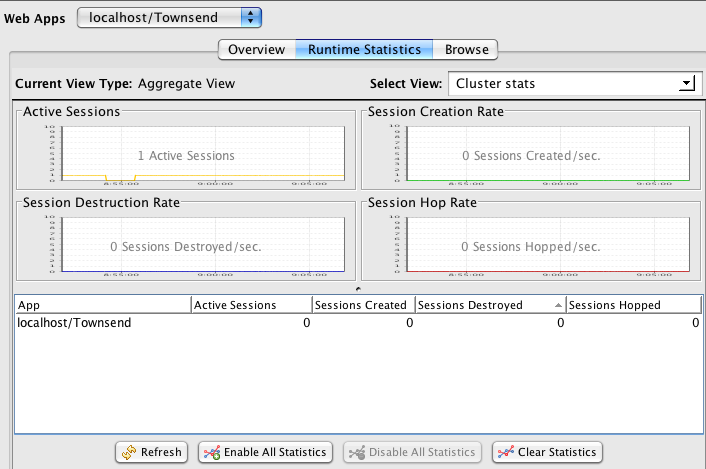
The** Statistics** panel displays session statistics in history graphs and a table. The graphs are useful for recognizing trends, while the table presents a snapshot of statistics.
Some of the main tasks you can perform in this panel are:
- View session statistics for the entire cluster.
- View session statistics for each Terracotta client (application server).
Session statistics are sampled at the rate determined by the rate set in the Options dialog box (see Runtime Statistics). Use the controls that appear below the statistics table to update the statistics:
- Refresh – Click Refresh to force the console to immediately poll for statistics.
- Clear – Click Clear All Statistics to wipe the current display of statistics.
- Enable Statistics – Turns on the gathering of statistics. Gathering statistics may have a negative impact on performance.
- Disable Statistics – Turns off the gathering of statistics.
You can set the scope of the statistics display using the Select View menu. To view statistics for the entire cluster, select Cluster stats. To view statistics for an individual Terracotta client (application server), choose that client from the Per Client View submenu.
session Statistics Graphs
The line graphs available display the following statistics over time:
- Active Sessions – The number of active sessions. The current total is overlaid on the graph.
- Session Creation Rate – The number of sessions being created per second. The current rate is overlaid on the graph.
- Session Destruction Rate – The number of sessions being torn down per second. The current rate is overlaid on the graph.
- Session Hop Rate – The number of sessions that have changed application servers, per second. The current rate is overlaid on the graph.
Session Statistics Table
The session statistics table displays a snapshot of the following statistics for each clustered application:
- App – The hostname and application context.
- Active Sessions – The aggregate number of active sessions.
- Sessions Created – The total number of sessions created.
- Sessions Destroyed – The total number of sessions destroyed.
- Sessions Hopped – The total number of sessions hopped.
The snapshot is refreshed each time you display the Statistics panel. To manually refresh the table, click Refresh.
Browse
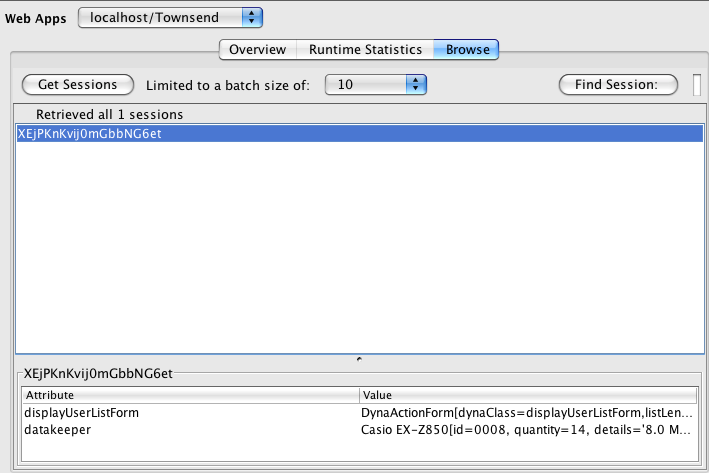
The Browse panel lists active sessions and has the following controls:
- Get Sessions – Obtain or refresh the list of session IDs of all active sessions. The session IDs are sorted from most recently created sessions at the top of the list to oldest sessions at the bottom.
- Batch-size menu – Choose a maximum number of sessions to return with Get Sessions.
- Find Session – Find sessions in the sessions table. To locate specific sessions, enter a string to match, then click Find Session.
To view the attributes and attribute values for a session, select the session ID in the sessions table. The session's existing attributes and values are displayed in the panel below
To manually expire a session, select the session's ID and open its context menu (for example, right-click on the session ID), then choose Expire from the context menu.
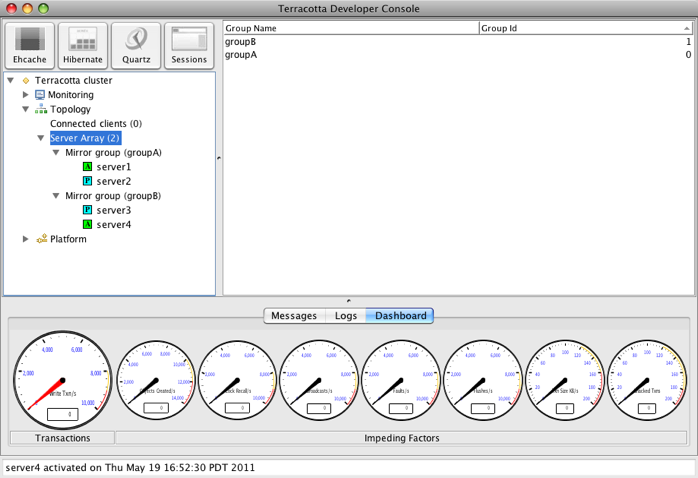
Working with Terracotta Server Arrays
Terracotta servers are arranged in mirror groups, each of which contains at least one active server instance. A High Availability mirror group also contains one backup server instance, sometimes called a passive server or "hot standby." Under the Topology node, a Server Array node lists all of the mirror groups in the cluster.
To view a table of mirror groups with their group IDs, expand the Topology node, then click Server Array.
To view a table of the servers in a mirror group, expand the Server Array node, then click the mirror group whose servers you want to display. The table of servers includes each server's status and name, hostname or IP address, and JMX port.
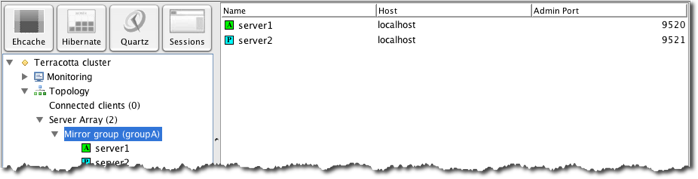
To view the servers' nodes under a mirror-group node, expand the mirror-group node.
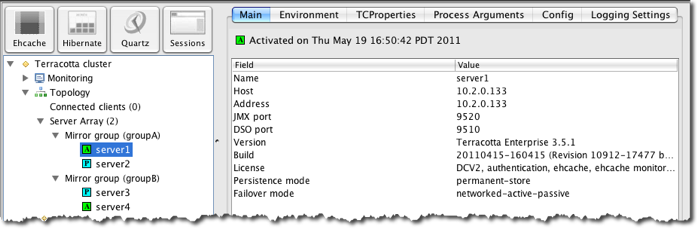
Server Panel
Selecting a specific server's node displays that server's panel, with the following tabs.
The Main tab displays the server status and a list of properties, including the server's IP address, version, license, and persistence and failover modes.
The following tabs display environment and configuration information, and provide a Find tool for performing string searches on that information:
- Environment – The server's JVM system properties.
- TCProperties – The Terracotta properties that the server is using.
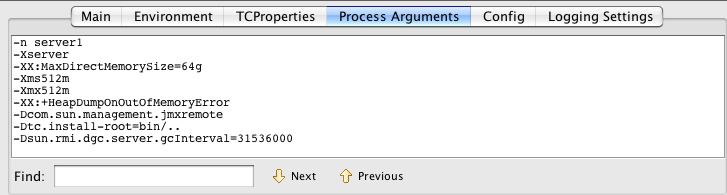
- Process Arguments – The JVM arguments that the server was started with.
- Config – The Terracotta configuration that the server is using.
The Logging Settings tab provides controls for setting logging options, each of which reports on data captured in five-second intervals:
- FaultDebug – Logs the types of objects faulted from disk and the number of faults by type.
- RequestDebug – Logs the types of objects requested by clients and the number of requests by type.
- FlushDebug – Logs the types of objects flushed from clients and a count of flushes by type.
- BroadcastDebug – Logs the types of objects that changed and caused broadcasts to other clients, and a count of those broadcasts by type.
- CommitDebug – Logs the types of objects committed to disk and a count of commits by type.
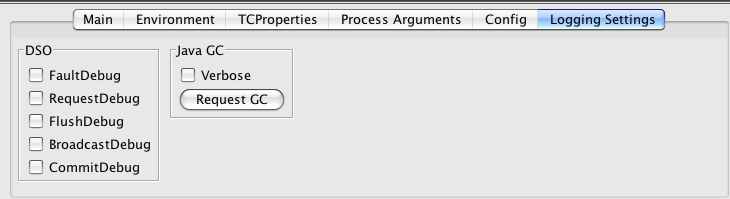
The Logging Settings tab also provides Java garbage-collection controls.
Connecting and Disconnecting from a Server
The Terracotta Developer Console connects to a cluster through one of the cluster's Terracotta servers. Being connected to a server means that the console is listening for JMX events coming from that server.
| If you have confirmed that a Terracotta server is running, but the Terracotta Developer Console is unable to connect to it, a firewall on your network could be blocking the server's JMX port. |
The console is disconnected from a cluster's servers when it's disconnected from the cluster. The console is also disconnected from a server when that server is shut down, even though the server may still appear in the console as part of the cluster. A server's connection status is indicated by its status light (see Server Status (server-stat)).
Note that disconnecting from a server does not shut the server down or alter its status in the cluster. Servers can be shut down using the stop-tc-server script (see Start and Stop Server Scripts (start-tc-server, stop-tc-server)).
| A server shutdown button is available in the Terracotta Operations Center. |
Server Connection Status
A Terracotta server's connection status is indicated by a status light next to the server's name. The light's color indicates the server's current connection status. A cluster can have one server, or be configured with multiple servers that communicate state over the network or use a shared file-system.
The following table summarizes the connection status lights.
| Status Light | Server Status | Notes |
|---|---|---|
| GREEN* | Active | The server is connected and ready for work. |
| RED* | Unreachable | The server, or the network connection to the server, is down. |
| YELLOW* | Starting or Standby | A server is starting up; in a disk-based multi-server cluster, a passive server goes into standby mode until a file lock held by the active server is released. Normally the file lock is released only when the active server fails. The passive will then move to ACTIVE state (green status light). |
| ORANGE* | Initializing | In a network-based multi-server cluster, a passive server must initialize its state before going into standby mode. |
| CYAN* | Standby | In a network-based multi-server cluster, a passive server is ready to become active if the active server fails. |
Working with Clients
Terracotta clients that are part of the cluster appear under the Connected clients node. To view the Connected clients node, expand the Topology node. The Connected clients panel displays a table of connected clients. The table has the following columns:
- Host - The client machine's hostname.
- Port - The client's DSO Port.
- ClientID - The client's unique ID number.
- Live Objects - The number of shared objects currently in the client's heap.
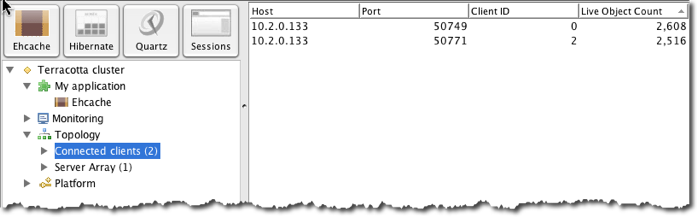
To view the client nodes that appear in the Connected clients panel, expand the Connected clients node.
Client Panel
Selecting a specific client's node displays that client's panel, with the following tabs.
The Main tab displays a list of client properties such as hostname and DSO port.
The following tabs display environment and configuration information, and provide a Find tool for performing string searches on that information:
- Environment – The client's JVM system properties.
- TCProperties – The Terracotta properties that the client is using.
- Process Arguments – The JVM arguments that the client was started with.
- Config – The Terracotta configuration the client is using.
The Logging Settings tab provides options to set logging items corresponding to DSO client debugging as well as Java garbage-collection controls. See the Configuration Guide and Reference for details on the various debug logging options.
Connecting and Disconnecting Clients
When started up properly, a Terracotta client is automatically added to the appropriate cluster.
When a Terracotta client is shut down or disconnects from a server, that client is automatically removed from the cluster and no longer appears in the Terracotta Developer Console .
| A client disconnection button is available in the Terracotta Operations Center. |
Monitoring Clusters, Servers, and Clients
The Terracotta Developer Console provides visual monitoring functions using dials, icons, graphs, statistics, counters, and both simple and nested lists. You can use these features to monitor the immediate and overall health of your cluster as well as the health of individual cluster components.
Client Flush and Fault Rate Graphs
Client flush and fault rates are a measure of shared data flow between Terracotta servers and clients. These graphs can reflect trends in the flow of shared objects in a Terracotta cluster. Upward trends in flow can indicate insufficient heap memory, poor locality of reference, or newly changed environmental conditions. For more information, see Client Flush Rate (Cluster, Server, Client) and Client Fault Rate (Cluster, Server, Client).
Cache Miss Rate Graph
The Cache Miss Rate measures the number of client requests for an object that cannot be met by a server's cache and must be faulted in from disk. An upward trend in this graph can expose a bottleneck in your cluster. For more information, see onheap fault/flush Rate (Cluster, Server).
Real-Time Performance Monitoring
Real-time cluster monitoring allows you to spot issues as they develop in the cluster.
Dashboard
The cluster activity gauges provide real-time readings of critical cluster metrics.
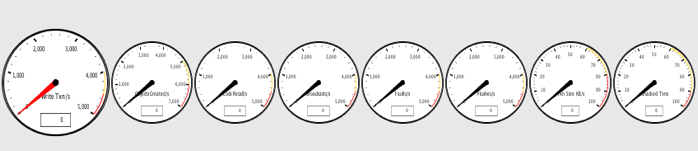
Each gauge has the following characteristics:
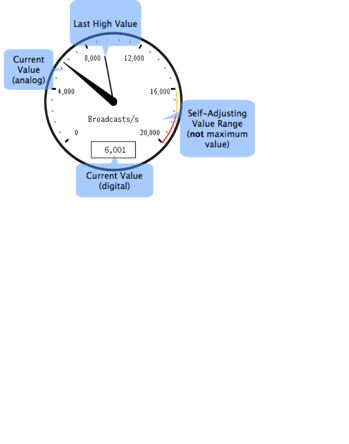
- Yellow and red zones on the dial indicate when the metric value has reached warning or extreme levels.
- A digital readout field displays the metric's current value.
- A tooltip shows the metric's full name, last maximum value, and average value (over all samples).
- By default, values are sampled over one-second intervals (except for Unacked Txns). The sample rate can be changed in the Options dialog box (see Runtime Statistics).
- A "high-water" mark tracks the last high value, fading after several seconds.
- A self-adjusting value range uses a built-in multiplier to automatically scale with the cluster.
The left-most gauge (the large dial with the red needle) measures the rate of write transactions, which reflects the work being done in the cluster, based on Terracotta transactions. This gauge may have a high value or trend higher in a busy cluster. An indication that the cluster may be overloaded or out of tune is when this gauge is constantly at the top of its range.
The remaining gauges, which measure "impeding factors" in your cluster, typically fluctuate or remain steady at a low value. If any impeding factors consistently trend higher over time, or remain at a high value, a problem may exist in the cluster. These gauges are listed below:
- Objects Created/s -- The rate of shared objects being created. A rising trend can have a negative impact on performance by reducing available memory and necessitating more garbage collection.
- Lock Recalls/s -- The number of locks being recalled by Terracotta servers. Growing lock recalls result from a high contention for shared objects, and have a negative performance impact. Higher locality of reference can usually lower the rate of lock recalls.
- Broadcasts/s -- The number of object changes being communicated by the server to affected clients. High broadcast rates raise network traffic and can have a negative performance impact. Higher locality of reference can usually lower the need for broadcasts.
- Faults/s -- Rate of faulting objects from servers to all connected clients. A high or increasing value can indicate one or more clients running low on memory or poor locality of reference.
- Flushes/s -- Rate of flushing objects from all connected clients to servers. A high or increasing value can indicate one or more clients running low on memory.
- Transaction Size KB/s -- Average size of total transactions.
- Unacked Txns -- The current count of unacknowledged client transactions. A high or increasing value can indicate one more troubled clients.
Runtime Statistics
Runtime statistics provide a continuous feed of sampled real-time data on a number of server and client metrics. The data is plotted on a graph with configurable polling and historical periods. Sampling begins automatically when a runtime statistic panel is first viewed, but historical data is not saved.
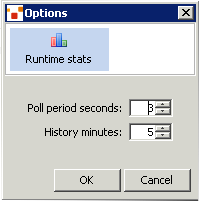
To adjust the poll and history periods, choose Options from the Tools menu. In the Options dialog, adjust the values in the polling and history fields. These values apply to all runtime-statistics views.
To record and save historical data, see Cluster Statistics Recorder.
To view runtime statistics for a cluster, expand the cluster's Monitoring node, then click the Runtime statistics node.
Use the Select View menu to set the runtime statistics view to one of the following:
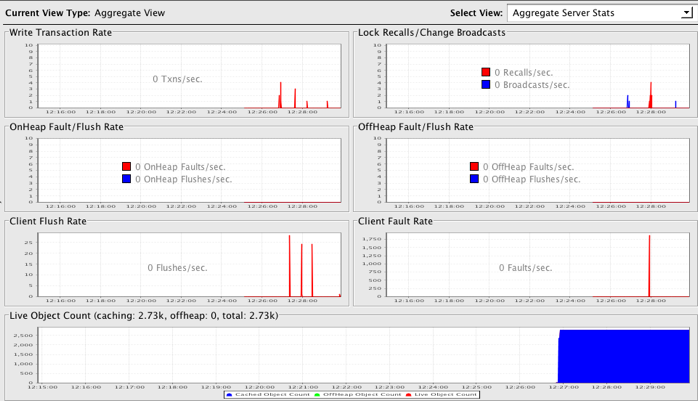
- Aggregate View – Choose Aggregate Server Stats to display cluster-wide statistics.
- Per-Client View – Choose a client to display runtime statistics for that client.
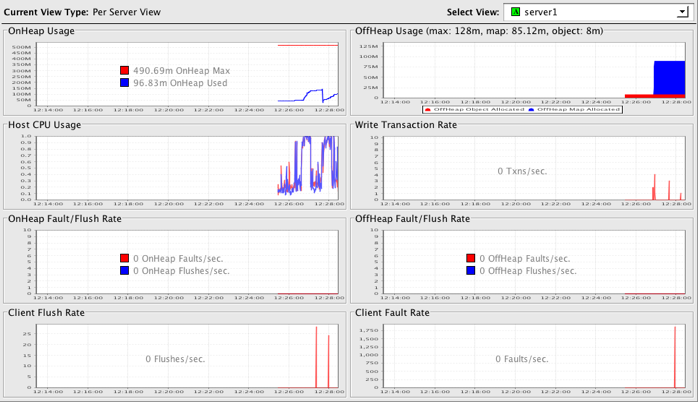
- Per-Server View – Choose a server to display runtime statistics for that server.
Specific runtime statistics are defined in the following sections. The cluster components for which the statistic is available are indicated in parentheses.
| Fatal errors can occur when collecting resource-specific statistics, such as those related to CPU and disk usage, due to incompatibilities between the Hyperic SIGAR statistics-collection framework and certain platforms. See errors related to "Hyperic" in the Technical FAQ for information on how to prevent these errors. |
heap or onHeap Usage (Server, Client)
Shows the amount, in megabytes, of maximum available heap and heap being used.
| For all statistics, if "Cluster" is indicated as a cluster component, it indicates the aggregate for all servers in the clusters. |
offheap usage (server)
This statistic appears only if BigMemory is being used (see Improving Server Performance With BigMemory).
Shows the amount, in megabytes or gigabytes, of maximum available off-heap memory and off-heap memory being used.
Host CPU Usage (Server, Client)
Shows the CPU load as a percentage. If more than one CPU is being used, each CPU's load is shown as a separate graph line.
Write Transaction Rate (Cluster, Server, Client)
Shows the number of completed Terracotta transactions. Terracotta transactions are sets of one or more clustered object changes, or writes, that must be applied atomically.
| Some statistics available through the Terracotta Developer Console are about Terracotta transactions. Terracotta transactions are not application transactions. One Terracotta transaction is a batch of one or more writes to shared data. |
onheap fault/flush Rate (Cluster, Server)
Faults from disk occur when an object is not available in a server's in-memory (on-heap) cache. Flushes occur when the on-heap cache must clear data due to memory constraints. The OnHeap Fault/Flush Rate statistic is a measure of how many objects (per second) are being faulted and flushed from and to the disk in response to client requests. Objects being requested for the first time, or objects that have been flushed from the server heap before a request arrives, must be faulted in from disk. High rates could indicate inadequate memory allocation at the server.
If BigMemory is being used (see Improving Server Performance With BigMemory), faults and flushes are to off-heap memory.
offheap fault/flush Rate (Cluster, Server)
This statistic appears only if BigMemory is being used (see Improving Server Performance With BigMemory).
Faults from disk occur when an object is not available in a server's in-memory off-heap cache. Flushes occur when the off-heap cache must clear data due to memory constraints. The OffHeap Fault/Flush Rate statistic is a measure of how many objects (per second) are being faulted and flushed from and to the disk in response to client requests. Objects being requested for the first time, or objects that have been flushed from off-heap memory before a request arrives, must be faulted in from disk. High rates could indicate inadequate memory allocation at the server.
Unacknowledged Transaction Broadcasts (Client)
Every Terracotta transactions in a Terracotta cluster must be acknowledged by Terracotta clients with in-memory shared objects that are affected by that transaction. For each client, Terracotta server instances keep a count of transactions that have not been acknowledged by that client. The Unacknowledged Transaction Broadcasts statistic is a count of how many transactions the client has yet to acknowledge. An upward trend in this statistic indicates that a client is not keeping up with transaction acknowledgments, which can slow the entire cluster. Such a client may need to be disconnected.
Client Flush Rate (Cluster, Server, Client)
The Client Flush Rate statistic is a measure of how many objects are being flushed out of client memory to the Terracotta server. These objects are available in the Terracotta server if needed at a later point in time. A high flush rate could indicate inadequate memory allocation at the client.
On a server, the Client Flush Rate is a total including all clients. On a client, the Client Flush Rate is a total of the objects that client is flushing.
Client Fault Rate (Cluster, Server, Client)
The Client Fault Rate statistic is a measure of how many objects are being faulted into client memory from the server. A high fault rate could indicate poor locality of reference or inadequate memory allocation at the client.
On a server, the Client Fault Rate is a total including all clients. On a client, the Client Fault Rate is a total of the objects that have been faulted to that client.
| When the Terracotta server faults an object, it also faults metadata for constructing a certain number of the objects referenced by or related to that object. This improves locality of reference. See the definition of the fault-count property in the Terracotta Configuration Guide and Reference for more information. |
Lock Recalls / Change Broadcasts (Cluster)
Terracotta servers recall a lock from one client as a response to lock requests from other clients. An upward trend in lock recalls could indicated poor locality of reference.
Change broadcasts tracks the number of object-change notifications that Terracotta servers are sending. See l2 changes per broadcast, l2 broadcast count, and l2 broadcast per transaction for more information on broadcasts.
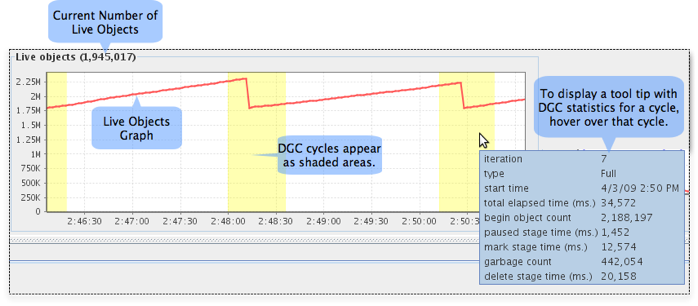
Live Objects (Cluster)
Shows the total number of live objects on disk (red), in the off-heap cache (green), and in the on-heap cache (blue).
If the trend for the total number of live objects goes up continuously, clients in the cluster will eventually run out of memory and applications may fail. Upward trends indicate a problem with application logic, garbage collection, or a tuning issue on one or more clients. The total number of live objects is given in the graph's title.
Distributed Garbage Collection
Objects in a DSO root object graph can become unreferenced and no longer exist in the Terracotta client's heap. These objects are eventually marked as garbage in a Terracotta server instance's heap and from persistent storage by the Terracotta Distributed Garbage Collector (DGC). The DGC is unrelated to the Java garbage collector.
| For more information on the DGC, see the Terracotta Concept and Architecture Guide. |
To view a history table of DGC activity in the current cluster, expand the cluster's Cluster heap node, then click the Garbage collection node. The history table is automatically refreshed each time a collection occurs. Each row in the history table represents one distributed garbage collection cycle, with the following columns:
| Column | Definition | Values |
|---|---|---|
| Iteration | The index number of the DGC cycle | Sequential integer |
| Type | The type of cycle | Full – Running a full collection cycle targeting all eligible objects. Young – Running a collection cycle targeting Young Generation objects. |
| Status | The collection cycle's current state | START – Monitoring for object reference changes and collecting statistics such as the object begin count. MARK – Determining which objects should be collected and which should not. PAUSE – Determining if any marked objects should not be collected. MARK COMPLETED – Stops checking for reference changes (finalizing marked object list). DELETE – Deleting objects. COMPLETE – Completed cycle. |
| Start time | The date and time the cycle began | Date and time stamp (local server time) |
| Begin count | The total number of shared objects held by the server | Integer counter |
| Paused stage | The total time the DGC paused | Milliseconds |
| Mark stage | The total time the DGC took to mark objects for collection | Milliseconds |
| Garbage count | The number of shared objects marked for collection | Integer counter |
| Delete stage | The total time the DGC took to collect marked objects | Milliseconds |
| Total elapsed time | The total time the DGC took to pause, mark objects, and collect marked objects | Milliseconds |
The DGC graph combines a real-time line graph (with history) displaying the DGC total elapsed time with a bar graph showing the total number of freed objects.
Triggering a DGC Cycle
The DGC panel displays a message stating the configured frequency of DGC cycles. To manually trigger a DGC cycle, click Run DGC.
| There are two types of DGC: Periodic and inline. The periodic DGC is configurable and can be run manually (see below). Inline DGC, which is an automatic garbage-collection process intended to maintain the server's memory, runs even if the periodic DGC is disabled. |
Logs and Status Messages
Click the Logs tab in the Status Panel to display log messages for any of the servers in the cluster. From the View log for menu, choose the server whose logs you want to view.
The status bar at the bottom of the console window displays messages on the latest changes in the cluster, such as nodes joining or leaving.
Operator Events
The Operator Events panel, available with enterprise editions of Terracotta, displays cluster events received by the Terracotta server array. You can use the Operator Events panel to quickly view these events in one location in an easy-to-read format, without having to search the Terracotta logs.
To view the Operator Events panel, expand the Monitoring node in the cluster list, then click the Operator Events node.
Events are listed in a table with the following columns:
- Event Type – The level of the event (INFO, WARN, DEBUG, ERROR, CRITICAL) along with a color-coded light corresponding to the severity of the event.
- Time of Event – The event's date and time stamp.
- Node – The server receiving the event. Concatenated events are indicated when more than one server is listed in the Node column.
- Event System – The Terracotta subsystem that generated the event. The choices are MEMORY_MANAGER (virtual memory manager), DGC (distributed garbage collector), LOCK_MANAGER (cluster-wide locks manager), DCV2 (server-side caching), CLUSTER_TOPOLOGY (server status), and HA (server array).
- Message – Message text reporting on a discrete event.
An event appears in bold text until it is manually selected (highlighted). The text of an event that has been selected is displayed in regular weight.
| The Operator Events panel concatenates events received by more than one server so that they appear in one row. Concatenated events are indicated when more than one server is listed in the Node column. To view these concatenated events, float your mouse button over the event to open a tool-tip list. |
The Operator Events panel has the following controls:
- Mark All Viewed – Click this button to change the text of all listed events from bold to regular weight.
- Export – Click this button to export a text file containing all listed events.
- Select View – Use this drop-down menu to filter the list of displayed events. You can filter the list of events based on type (level) or by the generating system (or subsystem). For example, if you choose INFO from the menu, only events with this event type are displayed in the event list.
Advanced Monitoring and Diagnostics
Tools providing deep views into the clustered data and low-level workings of the Terracotta cluster are available under the Platform node. These are recommended for developers who are experienced with Java locks, concurrency, reading thread dumps, and understanding statistics.
Shared Objects
Applications clustered with Terracotta use shared objects to keep data coherent. Monitoring shared objects serves as an important early-warning and troubleshooting method that allows you to:
- Confirm that appropriate object sharing is occurring;
- be alerted to potential memory issues;
- learn when it becomes necessary to tune garbage collection;
- locate the source of object over-proliferation.
The Terracotta Developer Console provides the following tools for monitoring shared objects:
These tools are discussed in the following sections.
Object Browser
The Object Browser is a panel displaying shared object graphs in the cluster. To view the Object Browser, expand the Clustered heap node, then click the Object browser node.
The Object Browser does not refresh automatically. You can refresh it manually in any of the following ways:
- Expand or collapse any part of any object graph.
- Press the F5 key on your keyboard.
- Right-click any item on the object graph that has an object ID (for example, @1001), then select Refresh from the context menu.
The following are important aspects of the object graph display:
- The top-level objects in an object graph correspond to the shared roots declared in the Terracotta server's configuration file.
- Objects referencing other objects can be expanded or collapsed to show or hide the objects they reference.
- Objects in the graph that are a collections type, and reference other objects, indicate the number of referenced objects they display when expanded. This number is given as a ratio in the format [X/Y], where X is the number of child elements being displayed and Y is the total number of child elements in the collection. Collections also have More and Less items in their context menus for manual control over the number of child elements displayed. By default, up to ten children (fields) are displayed when you expand a collections-type object in the object graph.
- A delay can occur when the object browser attempts to display very large graphs.
- An entry in the graph that duplicates an existing entry has an "up" arrow next to it. Click the up arrow to go to the existing entry.
- An entry in the graph called "Collected" with no data indicates an object that was made known to the console but no longer exists on the graph. The collected object will eventually disappear from the graph on refresh.
- Each element in the object appears with unique identifying information, as appropriate for its type. Each object appears with its fully qualified name.
To inspect a portion of an object graph, follow these steps:
Find the object ID of the object at the root of the portion you want to inspect. An object ID has the format @
. For example, @1001 can be an object ID. Enter that object ID in Inspect object.
Click Show....
A window opens containing the desired portion of the graph.
Cluster Object Browsing
To browse the shared-object graphs for the entire cluster, select Cluster Heap from the Select View menu. All of the shared objects in the cluster-wide heap are graphed, but the browser doesn't indicate which clients are sharing them.
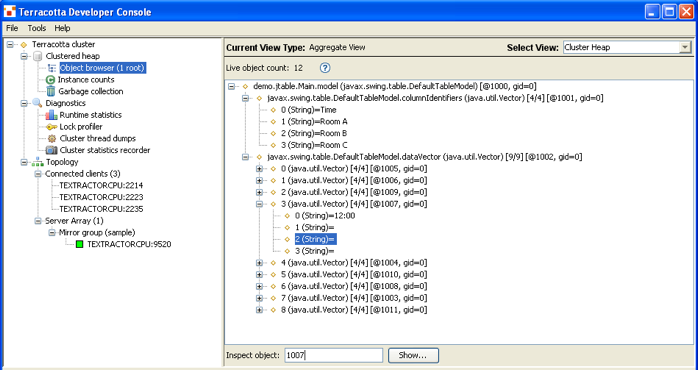
To see object graphs specific to a client, see Client Object Browsing.
The browser panel displays a running total of the live objects in the cluster. This is the number of objects currently found in the cluster-wide heap; however, this total does not correspond to the number of objects you see in the object graph because certain objects, including literals such as strings, are not counted. These uncounted objects appear in the object graph without an object ID.
Client Object Browsing
To browse the shared-object graphs in a specific client, select the client from the Select View menu. All of the shared object graphs known to that client are graphed, but the ones not being shared by the client are grayed out.
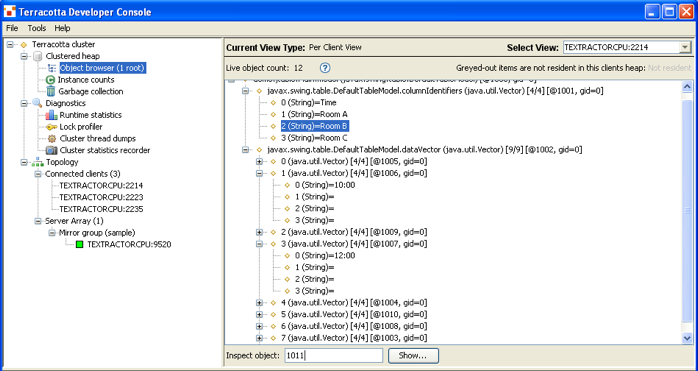
The browser panel displays a running total of the live objects in the client. This is the number of objects currently found in the client heap; however, this total does not correspond to the number of objects you see in the object graph because the following types of objects are not counted:
- Objects not being shared by the client
- These unshared objects are grayed out in the object-browser view.
- Literals such as strings These objects appear in the object graph without an object ID.
Classes Browser
Terracotta allows for transparent, clustered object state synchronization. To accomplish this, some of your application classes are adapted into new classes that are cluster-aware. Snapshots of the set of all such adapted classes known to the server are displayed in the Instance counts panel. The panel has the following tabs:
- Tabular – Lists all the adapted classes in a spreadsheet view, including the class name and a count of the number of instances of the class that have been created since the server started. Click the column title to sort along that column's contents.
- Hierarchical – Presents an expandable/collapsible Java package view of the adapted classes, along with a count of the number of instances of the class that have been created since the server started.
- Map – Displays an area map distinguishing the most (and least) heavily used adapted classes.
- Config snippet – A snippet from the <application> section of the Terracotta configuration file showing the how the instrumented classes are configured.
To refresh the values in the classes browser, select Refresh from the Instance counts context menu.
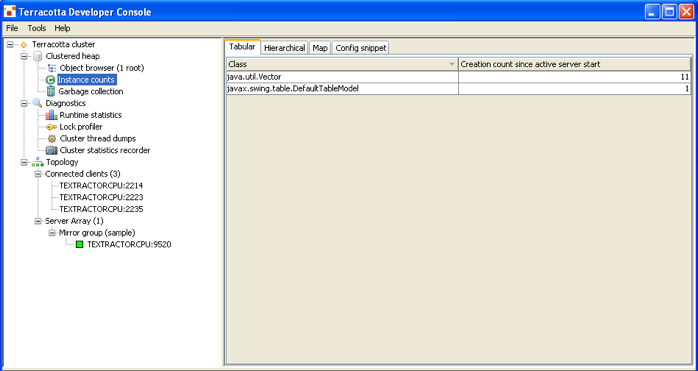
Runtime Logging of New Shared Objects
You can log the creation of all new shared objects by following these steps:
Select the target client in the cluster list.
Click the Logging Settings tab.
Enable NewObjectDebug from the Runtime list.
During development or debugging operations, logging new objects can reveal patterns that introduce inefficiencies or errors into your clustered application. However, during production it is recommended that this type of intensive logging be disabled.
See the Configuration Guide and Reference for details on the various debug logging options.
Lock Profiler
The Terracotta runtime system can gather statistics about the distributed locks set by the Terracotta configuration. These statistics provide insight into the workings of a distributed application and aid the discovery of highly-contented access to shared state. Statistics are displayed in a table (see The Statistics Table).
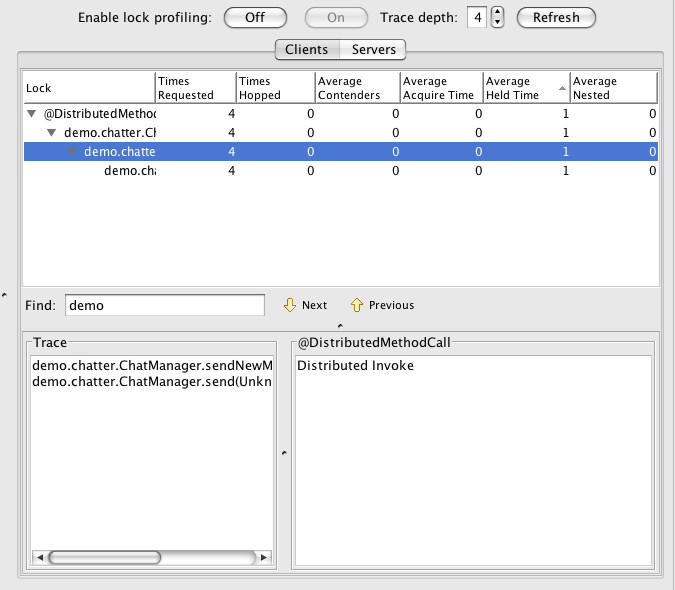
Using the Lock Profiler
To enable or disable lock-statistics gathering, follow these steps:
Expand the Diagnostics node, then click the Lock profiler node.
Click On to enable statistics gathering.
Click Off to disable statistics gathering.
Specify the Trace depth (lock code-path trace depth) to set the number of client call-stack frames to analyze. See Trace Depth for more information.
Click Clients to view lock statistics for Terracotta clients, or click Servers to view lock statistics for Terracotta servers. Client-view lock statistics are based on the code paths in the clustered application that result in a lock being taken out. Server-view lock statistics concern the cluster-wide nature of the distributed locks. See Lock Element Details for more information.
Click Refresh to display the latest statistics.
| Gathering and recording statistics can impact a cluster's performance. If statistics are being gathered, you are alerted in the cluster list by a flashing icon next to the affected cluster. |
Lock Names
Each lock has a corresponding identifier, the lock-id. For a named lock the lock-id is the lock name. For an autolock the lock-id is the server-generated id of the object on which that lock was taken out. An example of an autolock id is @1001. That autolock id corresponds to the shared object upon which distributed synchronization was carried out. You can use the object browser (see Object Browser) to view the state of shared object @1001.
Searching for Specific Locks
You can search for specific locks listed in the Lock column. Enter a string in Find, then click Next or Previous to move through matching entries.
Trace Depth
A single lock-expression in the configuration can result in the creation of multiple locks by the use of wildcard patterns. A single lock can be arrived at through any number of different code paths. For example, there could be 3 different call sequences that result in a particular lock being granted, with one of the paths rarely entered and another responsible for the majority of those lock grants. By setting the trace depth appropriately you can gain insight into the behavior of your application and how it can affect the performance of your clustered system.
The trace depth control sets the number of client call-stack frames that are analyzed per lock event to record lock statistics. A depth of 0 gathers lock statistics without regard to how the lock event was arrived at. A lock depth of 1 means that one call-stack frame will be used to disambiguate different code paths when the lock event occurred. A lock depth of 2 will use two frames, and so on.
| Trace stack frames can include Java source line numbers if the code is compiled with debugging enabled. This can be done by passing the `-g` flag to the `javac` command, or in Ant by defining the `javac` task with the `debug="true"` attribute. |
With a trace-depth setting of 1 all locks are recorded together, regardless of the call path. This is because the stack depth analyzed will always be just the method that resulted in the lock event (in other words the surrounding method). For example, a lock event that occurs within method Foo() records all lock events occurring within Foo() as one single statistic.
With a lock depth of 2, different call paths can be separated because both the surrounding method and the calling method are used to record different lock statistics. For example, the callers of Foo(), Bar1() and Bar2(), are also considered. A call path of Bar1() -> Foo() is recorded separately from Bar2() -> Foo().
The Statistics Table
| Lock Statistic | Description |
|---|---|
| Times Requested | Number of times this lock was requested by clients in the cluster. |
| Times Hopped | Times an acquired greedy lock was retracted from a holding client and granted to another client. |
| Average Contenders | Average number of threads wishing to acquire the lock at the time it was requested. |
| Average Acquire Time | Average time (in milliseconds) between lock request and grant. |
| Average Held Time | Average time (in milliseconds) grantee held this lock. |
| Average Nested | Average number of outstanding locks held by acquiring thread at grant time. |
| Terracotta employs the concept of greedy locks to improve performance by limiting unnecessary lock hops. Once a client has been awarded a lock, it is allowed to keep that lock until another client requests it. The assumption is that once a client obtains a lock it is likely to request that same lock again. For example, in a cluster with a single node repeatedly manipulating a single shared object, server lock requests should be 1 until another client enters the cluster and begins manipulating that same object. Server statistics showing "na" (undefined) are likely due to greedy locks. |
Lock Element Details
The bottom portion of the client's view displays details on the selected lock element. The currently selected lock trace is shown on the left and the configuration element responsible for the creation of the selected lock is shown on the right.
Recording and Viewing Statistics
Cluster Statistics Recorder
The Cluster Statistics Recorder panel can generate recordings of selected cluster-wide statistics. This panel has controls to start, stop, view, and export recording sessions. You can use the Snapshot Visualization Tool to view the recorded information.
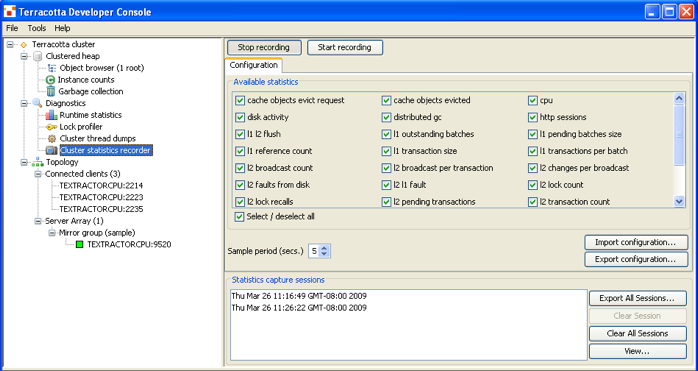
For definitions of available statistics, see Definitions of Cluster Statistics. To learn about configuring the Terracotta Cluster Statistics Recorder, using its command-line interface, and more, see the Platform Statistics Recorder Guide.
| Gathering and recording statistics can significantly impact a cluster's performance. If statistics are being gathered, you are alerted in the cluster list by a flashing icon next to the affected cluster. In a production environment or if testing performance, the impact of recording statistics should be well understood. |
Troubleshooting the Console
This section provides solutions for common issues that can affect both the Terracotta Developer Console and Operations Center.
Cannot Connect to Cluster (Console Times Out)
If you've verified that your Terracotta cluster is up and running, but your attempt to monitor it remotely using a Terracotta console is unsuccessful, a firewall may be the cause. Firewalls that block traffic from Terracotta servers' JMX ports prevent monitoring tools from seeing those servers. To avoid this and other connection issues that may also be attributable to firewalls, ensure that the JMX and DSO ports configured in Terracotta are unblocked on your network.
If it is certain that no firewall is blocking the connection, network latencies may be causing the console to time out before it can connect to the cluster. In this case, you may need to adjust the console timeout setting using the following property:
-Dcom.tc.admin.connect-timeout=100000
where the timeout value is given in milliseconds.
Failure to Display Certain Metrics Hyperic (Sigar) Exception
The Terracotta Developer Console (or Terracotta Operations Center) may fail to display (or graph) certain metrics, while at the same time a certain "Hyperic" (or "Sigar") exception is reported in the logs or in the console itself.
These two problems are related to starting Java from a location different than the value of JAVA_HOME. To avoid the Hyperic error and restore metrics to the Terracotta consoles, invoke Java from the location specified by JAVA_HOME.
| If Terracotta clients or servers are failing with exceptions related to Hyperic (Sigar) resource monitoring, see this Technical FAQ item. |
Console Runs Very Slowly
If you are using the Terracotta Developer Console to monitor a remote cluster, especially in an X11 environment, issues with Java GUI rendering may arise that slow the display. You may be able to improve performance simply by changing the rendering setup.
If you are using Java 1.7, set the property sun.java2d.xrender to "true" to enable the latest rendering technology:
-Dsun.java2d.xrender=true
For Java 1.6, be sure to set property sun.java2d.pmoffscreen to "false" to allow Swing buffers to reside in memory:
-Dsun.java2d.pmoffscreen=false
For information about this Java system property, see http://download.oracle.com/javase/1.5.0/docs/guide/2d/flags.html#pmoffscreen.
You can add these properties to the Developer Console start-up script (dev-console.sh or dev-console.bat).
Console Logs and Configuration File
The Terracotta Developer Console stores a log file (devconsole.log.<number>) and a cofiguration file (.AdminClient.xml) in the home directory of the user who ran the console. The log file contains a record of errors encountered by the console.
Backing Up Shared Data
The Terracotta Operations Center provides console-based backup configuration. Enterprise versions of Terracotta also include a backup script (Database Backup Utility (backup-data)).
Update Checker
On a bi-weekly basis the Terracotta Developer Console will check, when first started, on updates to the Terracotta platform. By default, a notice informing you that an update check is about to be performed is displayed, allowing to ignore the immediate check, acknowledge and allow the check, or to disable further checking.
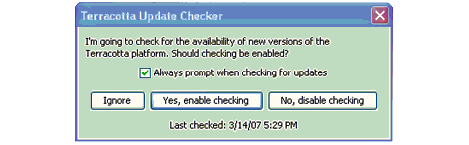
Should the update check be allowed, the Terracotta Developer Console will query the OpenTerracotta website (www.terracotta.org) and report on any new updates. Should the update checker feature be disabled, it can always be re-enabled via the Help > Update Checker... menu.
Definitions of Cluster Statistics
The following categories of cluster information and statistics are available for viewing and recording in the Cluster Statistics Recorder.
| l1 = Terracotta client l2 = Terracotta server instance |
cache objects evict request
The total number of objects marked for eviction from the l1, or from the l2 to disk. Evicted objects are still referenced, and can be faulted back to the l1 from the l2 or from disk to l2. High counts imply that free memory could be low.
cache objects evicted
The number of objects actually evicted. If this metric is not close in value to cache objects evict request_, then memory may not be getting freed quickly enough.
l1 l2 flush
The object flush rate when the L1 flushes objects to the L2 to free up memory or as a result of GC activity. The object are not literally copied to the L2 — this data already exists on the L2 — they are removed from the L1.
l2 faults from disk
The number of times the l2 has to load objects from disk to serve l1 object demand. A high faulting rate could indicate an overburdened l2.
l2 l1 fault
The number of times an l2 has to send objects to an l1 because the objects do not exist in the l1 local heap due to memory constraints. Better scalability is achieved when this number is lowered through improved locality and usage of an optimal number of JVMs.
memory (usage)
The amount of memory (heap) usage over time.
vm garbage collector
The standard Java garbage collector's behavior, tracked on all JVMs in the cluster.
distributed gc (distributed garbage collection, or DGC)
The behavior of the Terracotta tool that collects distributed garbage on an l2. The DGC can pause all other work on the l2 to ensure that no referenced objects are flagged for garbage collection.
l2 pending transactions
The number of Terracotta transactions held in memory by a Terracotta server instance for the purpose of minimizing disk writes. Before writing the pending transactions, the Terracotta server instance optimizes them by folding in redundant changes, thus reducing its disk access time. Any object that is part of a pending transaction cannot be changed until the transaction is complete.
stage queue depth
The depth to which visibility into Terracotta server-instance work-queues is available. A larger depth value allows more detail to emerge on pending task-completion processes, bottlenecks due to application requests or behavior, types of work being done, and load conditions. Rising counts (of items in these processing queues) indicate backlogs and could indicate performance degradation.
server transaction sequencer stats
Statistics on the Terracotta server-instance transaction sequencer, which sequences transactions as resources become available while maintaining transaction order.
network activity
The amount of data transmitted and received by a Terracotta server instance in bytes per second.
l2 changes per broadcast
The number of updates to objects on disk per broadcast message (see l2 broadcast count).
message monitor
The network message count flowing over TCP from Terracotta clients to the Terracotta server.
l2 broadcast count
The number of times that a Terracotta server instance has transmitted changes to objects. This "broadcast" occurs any time the changed object is resident in more than one Terracotta client JVM. This is not a true broadcast since messages are sent only to clients where the changed objects are resident.
l2 transaction count
The number of Terracotta transactions being processed (per second) by a Terracotta server instance.
l2 broadcast per transaction
The ratio of broadcasts to Terracotta transactions. A high ratio (close to 1) means that each broadcast is reporting few transactions, and implies a high co-residency of objects and inefficient distribution of application data. A low ratio (close to 0) reflects high locality of reference and better options for linear scalability.
system properties
Snapshot of all Java properties passed in and set at startup for each JVM. Used to determine configuration states at the time of data capture, and for comparison of configuration across JVMs.
disk activity
The number of operations (reads and writes) per second, and the number of bytes per second (throughput). The number of reads corresponds to l2 faulting objects from disk, while writes corresponds to l2 flushing objects to disk.
cpu (usage)
The percent of CPU resources being used. Dual-core processors are broken out into CPU0 and CPU1.