Open Source
Terracotta Management Console
Introduction
The Terracotta Management Console (TMC) is a web-based administration and monitoring application for Terracotta products. TMC connections are managed through the Terracotta Management Server (TMS), which must be running for the TMC to function.
To confirm the version of the TMC you are running, and for other information about the TMC, click About on the toolbar.
Setting Up User Accounts
When you first connect to the TMC, the authentication setup page appears, where you can choose to run the TMC with authentication or without. Authentication can also be enabled/disabled in the TMC Settings panel.
If you do not enable authentication, you can connect to the TMC without being prompted for a login or password.
If you enable authentication, the following choices appear:
- .ini file – Simple built-in role-based authentication.
- LDAP – Use with LDAP server. For more information, see Defining an LDAP Directory .
- Microsoft Active Directory – Use with an Active Directory server.
Instructions for setting up connections to LDAP and Active Directory are available with the form that appears when you select the LDAP or Active Directory. Setting up authorization and authentication controls access to the TMC but does not affect connections, which must be secured separately. In addition, an appropriate Terracotta license file is needed to run the TMC with security.
Simple Account-Based Authentication
Authentication using built-in role-based accounts backed by a .ini file is the simplest scheme. When you choose .ini-file authentication, you must restart the TMC using the stop-tmc and start-tmc scripts. A setup page appears for initializing the two accounts that control access to the TMC:
- Administrator – This account (username "admin") has read and write control over the TMC.
- Operator – This read-only account (username "operator") can view statistics and other information about configured connections. This account cannot add or edit connections.
Create a password for each account, then click Done to go to the login screen. The login screen appears each time a connection is made to the TMC.
Inactivity Timeout
The Terracotta Management Console allows a connected user to remained connected indefinitely, whether or not that user is active. To set a default timeout for inactivity, navigate to the WEB_INF directory, open the web.xml file, and uncomment the following block. You can then accept its default value of 30 for idleTimeoutMinutes or specify a different value:
  <context-param>
    <description>
      After this amount of time has passed without user activity, the user will be
      automatically logged out.
    </description>
    <param-name>idleTimeoutMinutes</param-name>
    <param-value>30</param-value>
  </context-param>
Note that internal to the TSA and TMC, the Apache Shiro session management is configured with an inactivity timeout of 10 minutes, expressed in milliseconds, securityManager.sessionManager.globalSessionTimeout = 600000. However, this timeout setting is unrelated to the human end-user activity.
For more information about Apache Shiro, see Shiro session management.
The TMC User Interface
A view of the TMC is shown below. Display panels and the connection-groups drop-down menu appear if an active (connected) connection group is available and selected.
Managing Connections
When you initially log on to the TMC, only default connection groups with default connections exist. If a node that can be monitored is running on localhost at the port specified by one of the default connections, that default connection appears as an active connection. Other default connections appear as unavailable (inactive) connections.
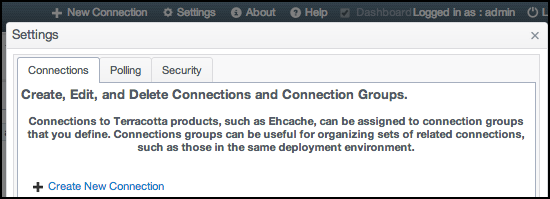
To create and edit connections and connection groups, use the Connections panel. To open the Connections panel, on the toolbar, click Settings or + New Connection on the toolbar. Connections are assigned to connection groups to simplify management tasks.
Working With Connections
Connections allow you to monitor and administer nodes (both clustered and standalone). Connections from the TMS to agents are made using a location URI in the following form:
<scheme>:<host-address>:<port>
URIs showing "http:" are for non-secure connections.
If the URI is for a server in a Terracotta Server Array, all other nodes participating in the cluster are automatically found. It is not required to create separate connections for those other nodes. A typical URI for a server is similar to:
http://myServer:9030
where an IP address or resolvable hostname is followed by the tsa-group-port (9530 by default), which is used as the management port. This port is configured in tc-config.xml.
A typical URI for a Terracotta client or BigMemory Go will appear similar to:
http://myHost:9888
where an IP address or resolvable hostname is followed by the agent's management port (9888 by default), which has been set in the node's configuration file. For BigMemory Go, for example, use the managementRESTService element in ehcache.xml.
Adding a Connection
To add a new connection:
- Click New Connection on the toolbar.
- Enter the location URI of the node you want to monitor, then click Next.
- Choose an existing connection group for the connection, or create a new one, then click Next.
- Enter a name to identify the connection.
- Enter a connection timeout or accept the default value.
- Enter a read timeout or accept the default value.
- Click Create Connection to save the new connection or Cancel to discard the new connection.
A screen appears confirming the agent found at the given location. If no agent is found, a warning appears and no connection can be set up. The location is relative to the machine running the Terracotta Management Server (TMS). The default location, "localhost", is the machine the TMS is running on, and might not be the machine your browser is running on.
The connection timeout ensures that the TMC does not hang waiting for a connection to an unreachable node.
The read timeout ensures that the TMC does not hang waiting for a connection to an unresponsive node.
Editing and Deleting Connections
Managed connections that appear in the connections list can be edited or deleted.
Delete a Connection
To delete an existing standalone connection, click Settings on the toolbar to view the Connections panel. Locate the connection under its connection group in the Configured Connections list and click the red X next to that connection's name.
To delete an existing cluster connection, click Settings on the toolbar to view the Connections panel. Locate the connection group in the Configured Connections list and click Delete next to that group's name.
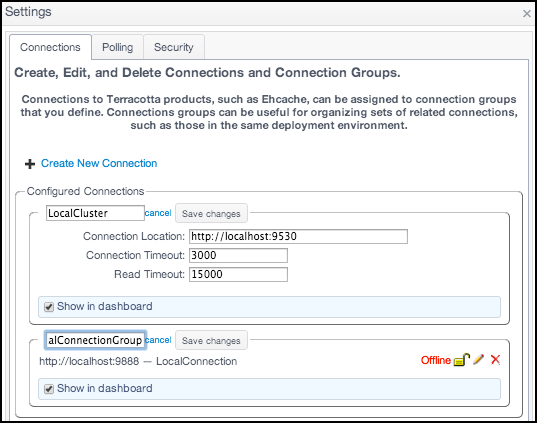
Edit a Standalone Connection
To edit a standalone connection:
- Click Settings on the toolbar.
- In the Connections panel, click the icon for the connection you want to edit.
- Edit the connection's location, group, and name.
- Enter a connection timeout or accept the default value.
- Enter a read timeout or accept the default value.
- Click Save Changes to save the new values or Cancel to revert to the original values.
You can choose a group for the connection from the menu of existing groups, or create a new connection group. If you create a new group, enter a name for the group.
The connection timeout ensures that the TMC does not hang waiting for a connection to an unreachable node.
The read timeout ensures that the TMC does not hang waiting for a connection to an unresponsive node.
Edit a Cluster Connection
To edit a cluster connection, click Edit for the cluster group, then edit the group name and connection URL. Click Save Changes to save the new values or Cancel to revert to the original values.
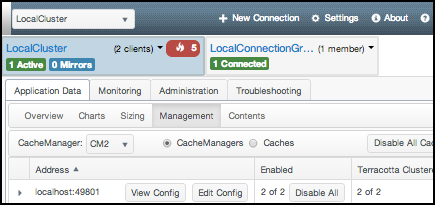
Monitoring Connection Groups
For every configured connection group, you can display a mini dashboard to view group status.
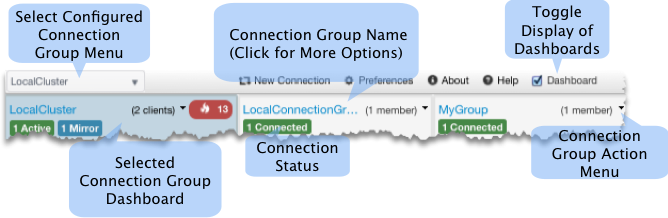
Each TSA connection-group dashboard displays the number of connected active (green) and mirror (blue) servers. It also displays the number of clients connected to that TSA. Certain other server states might also be indicated on the dashboard, including server starting or recovering (yellow) and server unreachable (red).
Each standalone connection group dashboard displays its number of configured connections and the number currently connected.
Each dashboard has a control drop-down menu with commands applicable to that dashboard and its associated connection group. For example, to hide a connection group's dashboard, choose Hide This Connection from the group's dashboard control menu. The connection group's connections are unaffected by hiding the dashboard. To restore the dashboard to the connections, click Settings from the toolbar, then enable Show in Dashboard checkbox for that group.
Managing Application Data
To manage the application data of nodes in a connection group, select the group, then click the Application Data tab. Each Application Data panel has a CacheManager and Scope menu to select which CacheManagers and nodes supply the data for that panel.
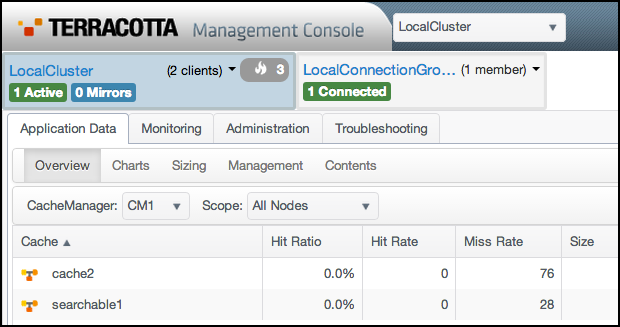
Overview Panel
The Overview panel displays health metrics for CacheManagers and their caches, including certain cache statistics to help you track performance and resource usage across all CacheManagers.
Real-time statistics are displayed in a table with the following columns:
- Hit Ratio – The ratio of cache hits to get attempts. A ratio of 1.00 means that all requested data was obtained from the cache (every put was a hit). A low ratio (closer to 0.00) implies a higher number of misses that result in more faulting in of data from outside the cache.
- Hit Rate – The number of cache hits per second. An effective cache shows a high number of hits relative to misses.
- Local Disk Hit Rate – The fault rate (data faulted in from the local disk).
- Local Heap Hit Rate – The rate of local (in-heap) hits (no faulting).
- OffHeap Hit Rate – The rate of local (off-heap) memory hits. Available only with BigMemory.
- Miss Rate – The number of cache misses per second. An effective cache shows a high number of hits relative to misses.
- Local Disk Miss Rate – The fault rate (data faulted in from remote source).
- Local Heap Miss Rate – The rate of local (in-heap) misses (causing faulting).
- OffHeap Miss Rate – The rate of local (off-heap) memory misses (causing faulting). Available only with BigMemory.
- Size – Overall data size (in entries).
- Local Heap Size – Overall data size (in entries) in the local heap.
- Local Disk Size – Overall data size (in entries) on the local disk.
- Local OffHeap Size – Overall data size (in entries) in local memory (off-heap). Available only with BigMemory.
- Local Heap Bytes – Overall data size (in bytes) in the local heap.
- Local Disk Bytes – Overall data size (in bytes) on the local disk.
- Local OffHeap Bytes – Overall data size (in bytes) in local memory (off-heap). Available only with BigMemory.
- Average Get Time – The average time for executing a get operation.
- Average Search Time – The Average Search Time graph displays how long each search operation takes (as well as the current values for that search time). This graph indicates how quickly cache searches are being performed. You might notice a correlation between how long searches are taking (Average Search Time) and how many searches are executed (Search Rate).
- Search Rate – The search-rate graph displays how many searches per second are being executed (as well as the current values for that rate). This graph provides a view into how many cache searches are being performed. You might notice a correlation between how long searches are taking (Average Search Time) and how many searches are executed (Search Rate).
- Put Rate – The number of cache puts executed per second. The number of puts always equals or exceeds the number of misses. This is because every miss leads to a put and updates are counted as puts. Efficient caches have a low overall put rate.
- Remove Rate – The rate of element eviction.
- Update Rate – The number of updates per second to elements in the cache. A high number of updates implies a high eviction rate or rapidly changing data.
- Expiration Rate – The number of elements per second reaching expiration in the cache. Expired elements are not automatically evicted.
- Eviction Rate – The number of elements being evicted per second from the cache. Evicted elements are expired or evicted according to a usage algorithm when size limits are exceeded.
- Transaction Rollback Rate – A Java Transaction API (JTA) graph that displays the rollback rate (as well as the current values for that rate) for transactional caches.
- Transaction Commit Rate – A JTA graph that displays the transaction commit rate (as well as the current values for that rate) for transactional caches.
- Writer Queue Length – The Write-Behind graph displays the total number of writes in the write-behind queue or queues (blue line), as well as the current value.
To choose the types of statistics displayed in the table, click Configure Columns to open a list of available statistics. Choose statistics (or set the option to display all statistics), then click OK to accept the change. The table immediately begins to display the chosen statistics.
To sort the table by a specific statistic, click the column head for that statistic.
Charts Panel
The Charts panel graphs the same statistics available in the Overview panel. This is useful for tracking performance trends and discovering potential issues.
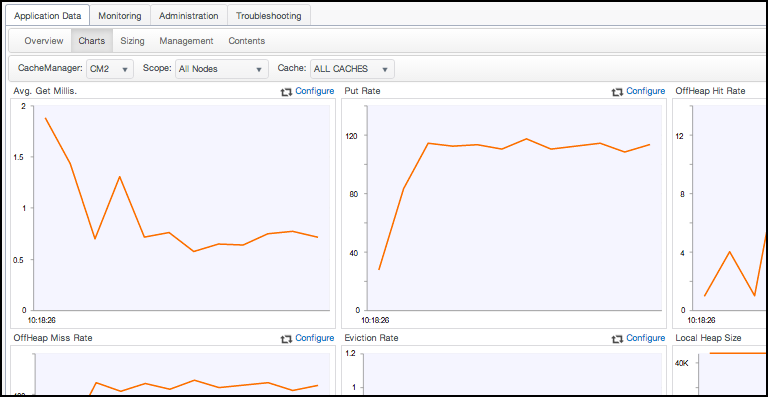
In addition to being able to select a CacheManager and scope for the displayed data, you can also select a specific cache (or all caches) for the selected CacheManager.
Each graph plots the appropriate metrics along the Y axis against system time (X axis). To view the value along a single point on a graph, float the mouse pointer over that point. This also displays the units used for the statistic being graphed.
To choose the type of statistic graphed by a particular chart, click the chart's corresponding Configure link to open a list of available statistics. Choose a statistic, then click OK to accept the change. The chart immediately begins to graph the chosen statistic.
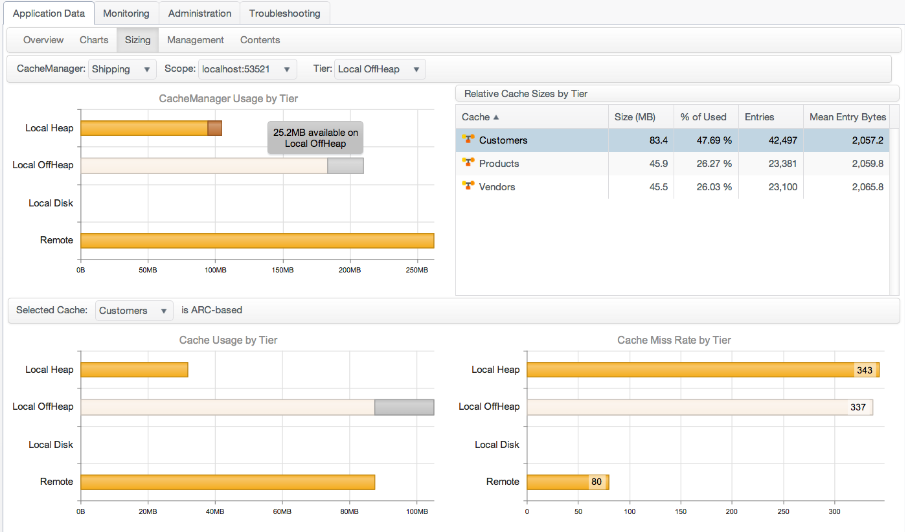
Sizing Panel
The Sizing panel provides information on the usage of the heap, off-heap, and disk tiers by the caches of the selected CacheManager.
 To view tier usage by any active CacheManager, select that CacheManager from the CacheManager drop-down menu.
Usage by Tier
The Relative Cache Sizes by Tier table displays usage of the tier selected from the Tier drop-down menu. The table has the following columns:
- Cache – The name of the cache. An icon indicates whether the cache is distributed (
 ) or not (
  ).
). - Size (MB) – The size of the cache's data in megabytes. This value is a snapshot and might not be accurate until the server has fully processed the data.
- % of Used – Percent of the total storage allotted to the cache that is currently used for cache data.
- Entries – The total number of cache entries.
- Mean Entry Size (bytes) – An estimate of the average size of each cache entry.
Click a row in the table to set the cache-related tier graphs to display values for the named cache.
Usage Graphs
The panel shows the following bar graphs:
- CacheManager Usage by Tier – Overall usage of each tier. Each bar shows the total resource allocated, the amount in use, and the amount available.
- Cache Usage by Tier – Usage of each tier by the selected cache. Choose the cache from the Selected Cache drop-down menu. Each bar shows the total resource allocated, the amount in use, and the amount available.
- Cache Miss Rate by Tier – The rate of cache misses at each tier of the cache specified in the Selected Cache drop-down menu. The number of misses is displayed in each bar.
To display an exact usage value, float the mouse pointer over a bar. To display values for that tier in the Relative Cache Sizes by Tier table, click a tier's bar. The selected tier's bar is lighter in color than the other bars.
The Selected Cache Menu
The Selected Cache drop-down menu determines which cache is shown in the cache-related tier graphs and highlighted in the Relative Cache Sizes by Tier. The menu also indicates if the cache uses size-based (automatic resource control, that is, ARC) or entry-based sizing.
Management Panel
The Management panel displays a table listing information about the selected CacheManager by node (where the CacheManager exists) or by its caches. Choose the CacheManagers radio button to show a table with a node list, or the Caches radio button to show a table with a cache list. These tables (and any sublist tables) can be sorted and ordered by any column by clicking the column head.
Global cache disable/enable controls at at the top of the panel.
List by Cache
The cache list is a table of caches under the selected cache manager.
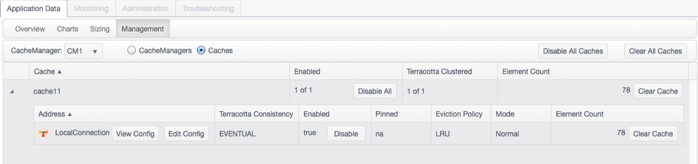
The table has the following columns:
- Cache – The name of the cache.
- Enabled – Shows how many instances of the cache are enabled out of the total number of instances in the cluster. Clicking Disable All disables (stops) all instances of the cache in the cluster. If caches are disabled, the control becomes Enable All, which can enable the operations of all of the cache instances at once.
- Terracotta Clustered – Shows how many of the instances of the cache are distributed.
- Element Count – Shows the total number of elements in all instances of the cache. Click Clear Cache to wipe the data from all instances of the cache in the cluster.
If a cache listing is expanded using the arrow to the left of the cache name, a sublist appears with a table of all of the nodes that contain the cache. The table has the following columns:
- Address – The connection name for node. To view the cache's configuration on the node, click View Config. Click Edit Config to open a dialog where you can edit the values of the following parameters (depending upon your settings, a subset of these parameters will be present):
- MaxEntriesInCache
- MaxEntriesLocalHeap
- MaxBytesLocalHeap
- TimeToIdleSeconds
- TimeToLiveSeconds
- Terracotta Consistency – For clustered caches, indicates whether consistency is EVENTUAL (default) or STRONG. Eventual consistency uses no cache-level locks for superior performance while allowing a short window when stale values might be read. Strong consistency uses locks to prevent any stale reads, but at a high cost to performance. This setting is not dynamic.
- Enabled – Indicates whether the cache is enabled on the node. Clicking Disable disables (stops) the cache on the node. If a cache is disabled, the control becomes Enable, which can enable the operations of the cache.
- Pinned – Indicates that the cache data is pinned to local memory (LOCALMEMORY), anywhere the cache's data is stored (INCACHE), or is not pinned (na).
- Eviction Policy – Indicates the eviction policy used for evicting entries from the cache. For example, LRU indicates that the Least Recently Used policy is in effect.
- Mode – Indicates whether the cache is in bulk-load or normal operating mode. Applications set the cache in bulk-load mode temporarily while warming the cache.
- Element Count – The total number of elements in the cache on the node. To wipe the data of the cache on the node, click Clear Cache.
List by CacheManager
The CacheManager list is a table of nodes under the selected cache manager.
The table has the following columns:
- Address – The connection name for node. To view the CacheManager's configuration on the node, click View Config. Click Edit Config to open a dialog where you can edit the values of the following parameters. Depending upon your settings, a subset of these parameters might be present.
- MaxEntriesInCache
- MaxEntriesLocalHeap
- MaxBytesLocalHeap
- TimeToIdleSeconds
- TimeToLiveSeconds
- Enabled – Shows how many instances of the cache are enabled out of the total number of instances in the cluster. Clicking Disable All disables (stops) all instances of the cache in the cluster. If caches are disabled, the control becomes Enable All, which can enable the operations of all of the cache instances at once.
- Terracotta Clustered – Shows how many of the instances of the cache are distributed.
- Element Count – The total number of elements in the cache on the node. To wipe the data of the cache on the node, click Clear Cache.
If a node listing is expanded using the arrow to the left of the connection name, a sublist appears with a table of all of the nodes that contain the cache:
- Cache – The name of the cache. To view the cache's configuration, click View Config. Click Edit Config to open a dialog where you can edit the values of the following parameters (depending upon your settings, a subset of these parameters will be present):
- MaxEntriesInCache
- MaxEntriesLocalHeap
- MaxBytesLocalHeap
- TimeToIdleSeconds
- TimeToLiveSeconds
- Terracotta Consistency – For clustered caches, indicates whether consistency is EVENTUAL (default) or STRONG. Eventual consistency uses no cache-level locks for superior performance while allowing a short window when stale values might be read. Strong consistency uses locks to prevent any stale reads, but at a high cost to performance. This setting is not dynamic.
- Enabled – Indicates whether the cache is enabled on the node. Clicking Disable disables (stops) the cache on the node. If a cache is disabled, the control becomes Enable, which can enable the operations of the cache.
- Pinned – Indicates that the cache data is pinned to local memory (LOCALMEMORY), anywhere the cache's data is stored (INCACHE), or is not pinned (na).
- Eviction Policy – Indicates the eviction policy used for evicting entries from the cache. For example, LRU indicates that the Least Recently Used policy is in effect.
- Mode – Indicates whether the cache is in bulk-load or normal operating mode. Applications set the cache in bulk-load mode temporarily while warming the cache.
- Element Count – The total number of elements in the cache on the node. To wipe the data of the cache on the node, click Clear Cache.
Content Panel
The Content panel allows you to issue BigMemory SQL queries against your caches.
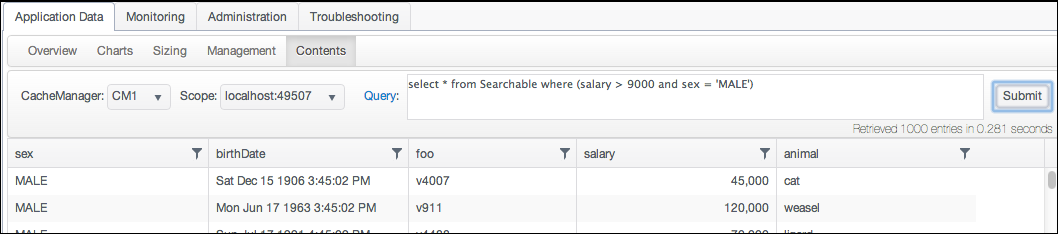 For more information about BigMemory SQL, click the Query link to see help, or go to BigMemory SQL Queries.
Monitoring Clusters
The Monitoring tab is available only for cluster connection groups. To monitor the functioning of the cluster, as well as the functioning of individual cluster components, use the features available under this tab.
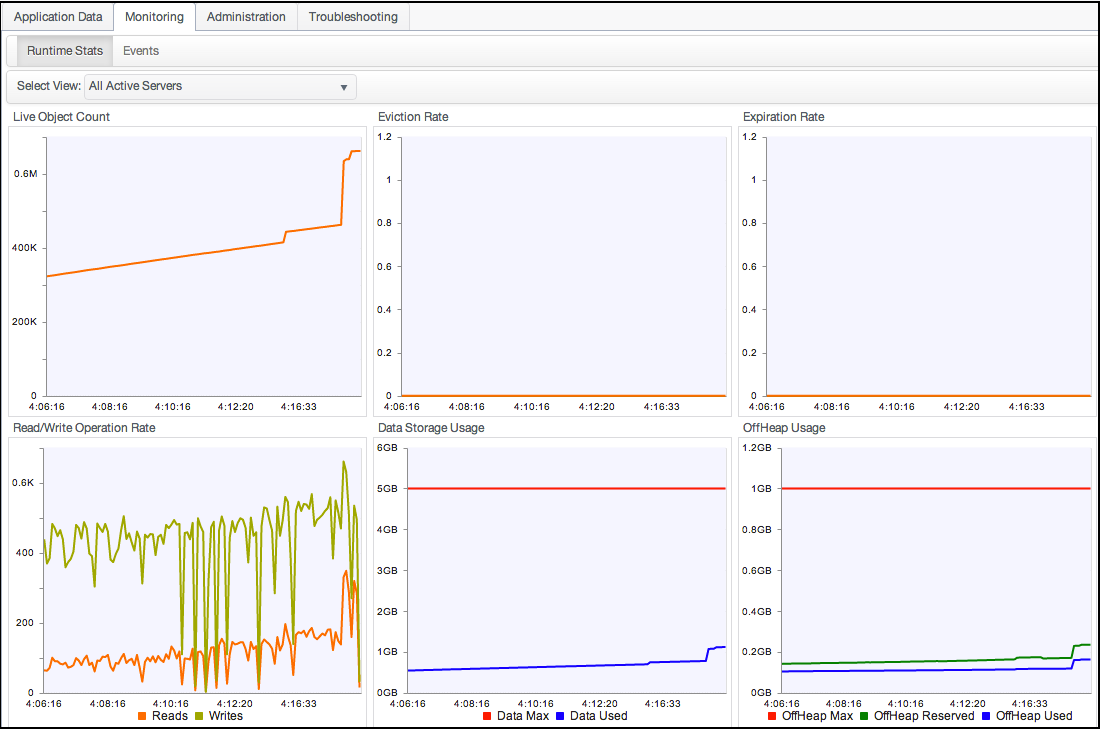
Runtime Statistics
The Runtime statistics graphs provide a continuous feed of server and client metrics. Sampling begins automatically when a runtime statistic panel is first viewed, but historical data is not saved.
Use the Select View menu to set the runtime statistics view to one of the following:
- All Servers – Display aggregated statistics for the TSA.
- Specified mirror group – Display aggregated statistics for the selected mirror group.
- Specified server – Display runtime statistics for the selected server.
- All Clients – Display aggregated statistics for all of the cluster's clients.
- Specified client – Display runtime statistics for the selected client.
Specific runtime statistics are defined in the following sections. The cluster components for which the statistic is available are indicated in the text.
Live Object Count
Shows the total number of live objects in the cluster, mirror group, server, or clients.
If the trend for the total number of live objects goes up continuously, clients in the cluster will eventually run out of memory and applications might fail. Upward trends indicate a problem with application logic, garbage collection, or the tuning of one or more clients.
Eviction Rate
Shows the number of entries being evicted from the cluster, mirror group, or server.
Expiration Rate
Shows the number of expired entries found (and being evicted) on the TSA, mirror group, or server.
Read/Write Operation Rate
Shows the number of completed writes (or mutations) in the TSA or selected server. Operations can include evictions and expirations. Large-scale eviction or expiration operations can cause spikes in the operations rate (see the corresponding evictions and expirations statistical graphs). This rate is low in read-mostly situations, indicating that there are few writes and little data to evict. If this number drops or deviates regularly from an established baseline, it might indicate issues with network connections or overloaded servers.
When clients are selected, this statistic is reported as the Write Transaction Rate, tracking client-to-server write transactions.
A measure of how many objects (per second) are being faulted in from the TSA in response to application requests. Faults from off-heap or disk occur when an object is not available in a server's on-heap cache. Flushes occur when the heap or off-heap cache must clear data due to memory constraints. Objects being requested for the first time, or objects that have been flushed from off-heap memory before a request arrives, must be faulted in from disk. High rates could indicate inadequate memory allocation at the server.
Data Storage Usage
BigMemory Max 4.1 provides support for a "Hybrid" mix of solid-state device (SSD) "flash drives" (an economical way to increase storage) along with the standard DRAM-based offheap storage. This Data Storage Usage graph, when compared to the Offheap Usage graph, shows that the hybrid maximum data storage, which includes both offheap memory and any "flash drives", can be on an entirely larger scale than off-heap alone.
Off-heap Usage
Shows the amount, in megabytes or gigabytes, of maximum available off-heap memory (configured limit), the "OffHeap Reserved" (made available), and used off-heap memory (containing data). These statistics appear only if BigMemory is in effect.
Events
The Events panel displays cluster events received by the Terracotta server array. You can use this panel to quickly view these events in one location in an easy-to-read format, without having to search the Terracotta logs.
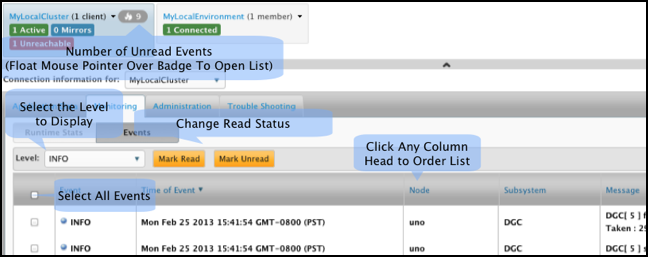
The number of unread events is shown in a badge on each clustered connection's mini dashboard. The badge color indicates the severity of unread events: red for warnings and above, or gray if all unread events are of lower severity.
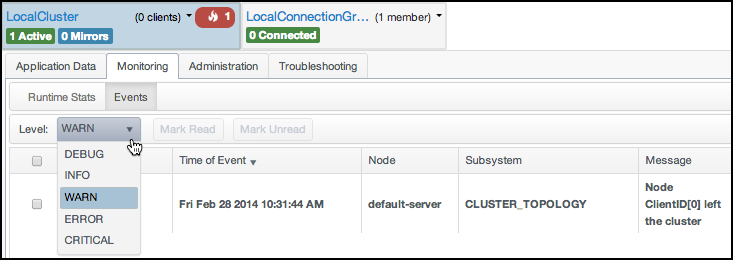
From Application Data > Events, the Level dropdown list allows you to select DEBUG, INFO, WARN, ERROR, or CRITICAL. Events will display that are equal to or higher than the level you select. For example:
- if you select INFO, only DEBUG events are filtered out
- if you select WARN, you will see events at the WARN, ERROR, and CRITICAL levels
For more information on specific events, see Event Types and Definitions.
Administering Clusters
The Administration panels provide information about the Terracotta cluster as well as tools for operations, including backing up cluster data.
Configuration
Using subpanels, the Configuration panel displays the status, environment, and configuration information for the servers and clients selected in the Cluster Node menu. This information is useful for debugging and when reporting problems.
The Main subpanel displays the server status and a list of properties, including IP address, version, license (capabilities), and restartability and failover modes. A specific server must be selected to view this subpanel. Administrators can shut down servers from this panel.
The following additional subpanels are available:- Environment – The server's JVM system properties.
- TCProperties – The Terracotta properties that the server is using.
- Process Args – The JVM arguments that the server was started with.
- TCConfig – The Terracotta configuration file that the server was started with.
Viewing Server Logs
The Logs panel displays live logs for the server selected in the Cluster Node menu. Scroll up to pause the live update (or click Pause). Scroll down to the end of the log to restart the live update (or click Resume).
Backing Up Cluster Data
The Backup panel provides a control for creating a backup of cluster data. The following server configuration elements control backup execution:
<restartable enabled="true"/>– Global setting required to be "true" for backups (for all servers) to be enabled. False by default.<data-backup>terracotta/backups– server-level element setting the path for storing the backup files. The default path is shown.
For more information on restoring from backups, see the Terracotta Server Array documentation.
Changing Cluster Topology
You can reload the Terracotta configuration to add or remove servers. The configuration file must be edited and made available to every server and client before it can be reloaded successfully.
For more information on the Terracotta configuration and editing the servers section, see the Terracotta Server Array documentation.
Offline Data
Data lifecycle operations have been added to the TMC for more control and visibility of clustered data. This includes the following capabilities:
- to enumerate caches and cache managers on the server side even when no clients are connected to it
- to destroy clustered cache when no clients are connected to it
- to know if clients are connected to the cache
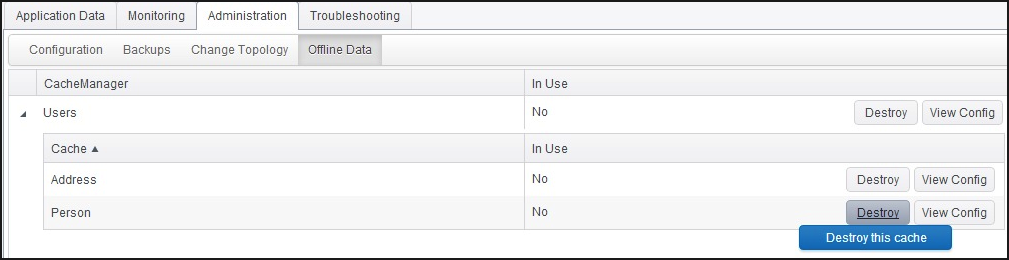
Only the administrator can see the "Destroy" feature. Use of this feature appears only in the TMC/TMS logs and not in server logs.
Troubleshooting Clusters
Troubleshooting Terracotta clusters with the TMC includes passive monitoring through viewing events and statistical trends using the monitoring panels as well as proactively investigating logs and thread dumps. If a cluster crosses certain resource thresholds, it might enter a mode of limited functionality to prevent a crash.
Understanding Special TSA Modes
The TMC flashes warnings if the TSA enters throttled or restricted mode. These modes are initiated if memory resources drop below a certain threshold and endanger the operations of the cluster. The TSA can automatically recover from throttled mode after sufficient expired data is evicted. Under certain conditions recovery might fail and restricted mode is entered. You can provide temporary relief by clearing or disabling caches. However, if the TSA enters this mode, it is an indication that memory resources have been under-allocated. The cluster might need to be stopped and additional steps taken to ensure that enough memory is available to cover cluster operations.
Generating Thread Dumps
You can get a snapshot of the state of each server and client in the Terracotta cluster using thread dumps. To display the console's thread-dumps feature, click Troubleshooting.
The thread-dump navigation pane lists completed thread dumps by date-time stamp. The contents of selected thread dumps are displayed in the right-side pane. To delete all shown thread dumps, click Clear All.
To generate a thread dump, follow these steps:
- Choose the target of the thread dump from the Scope menu.
- Click Take Thread Dump.
- Expand the entry created in the thread-dumps navigation pane to see the thread-dump entry or entries.
- Click a server or client entry to display the thread dump for that server or client.
- To archive listed thread dumps, click Download All.
- To remove all thread dumps from the list, click Clear All.
When complete, the thread dump appears in the thread-dumps navigation pane.
The entries correspond to servers and clients included in the thread dump.
Thread dumps are downloaded in the form of a zip file.
Servers that appear in the Scope menu but are not connected produce empty thread dumps.
Viewing Server Logs
To view the log of each server in the Terracotta cluster:
- Click Troubleshooting, then click Logs.
- Select the server from the Cluster Node menu.
- Click Pause (or scroll up) to pause the logs for easier viewing.
- To archive the logs, click Download Logs.
The logs will no longer update and will stop automatically scrolling. Click Resume (or scroll to the bottom) to restart the updating process.
Logs are downloaded as a zip file.
Settings
Click Settings on the toolbar to open a dialog where global TMC options can be configured.
Polling Period
Click the Polling tab to set the Polling Interval Seconds, which controls the granularity of polled statistical data. Note that shorter polling intervals can have a greater effect on the overall performance of the nodes being polled. To reset to default values, click Reset to Defaults.
Security Settings
Click the Security tab to configure security. If you choose to change the type of security used by the TMS, note the following:
- Changing security settings requires restarting the TMC.
- Changing the type of security might require additional configuration information and infrastructure.
- If you add security, connections to unsecured nodes might be lost.
- If you disable authentication, connections to secured nodes might be lost.
For SSL connections, you can use a custom truststore instead of the default Java cacerts. The custom truststore must be located in the default directory specified in the Security panel.
See the account setup section and additional TMC documentation for more information on setting up security.